The Modern Data Stack: Past, Present, and Future

Last edited on Oct 15, 2024
I recently gave a talk with this title at Sisu's Future Data conference, and since I think in prose and not Powerpoint, I had to write the blog post before I could put the slides together. It's taken me a bit to put the final polish on this and release it to the world, but I hope you find it valuable. If you'd like to watch the talk in full you can find it here.
Data products have drawn lots of attention, raised a lot of capital, and generated a lot of traction over the past decade. They've created a tremendous amount of change in how the most data-forward organizations are run---Stitch Fix is a million miles away from being a traditional clothing retailer and Airbnb does not at all resemble a traditional hotelier. And data products have fundamentally changed the careers of many of us data professionals, creating space for entirely new job titles and elevating once-menial roles into highly strategic career paths.
🗓 We have several talks lined up at Coalesce (next week!) on how data products have changed careers and teams: starting an analytics engineering team, structuring a data team, and adopting a product mindset.
But for all of this change, I feel like we've hit a bit of a plateau over the past few years. I've personally been working in the "modern data stack" now since late 2015---five whole years! And during that time, the set of products that make up this best-of-breed stack have been reasonably consistent (this list is certainly not exhaustive):
- Ingestion: Fivetran, Stitch
- Warehousing: Bigquery, Databricks, Redshift, Snowflake
- Transformation: dbt
- BI: Looker, Mode, Periscope, Chartio, Metabase, Redash
What's more, while there certainly have been incremental advances in each of these products in that timeframe, none of their core user experiences has fundamentally changed. If you fell asleep, Rip Van Winkle-style, in 2016 and woke up today, you wouldn't really need to update your mental model of how the modern data stack works all that much. More integrations, better window function support, more configuration options, better reliability... All of these are very good things, but they suggest a certain maturity, a certain stasis. What happened to the massive innovation we saw from 2012-2016?
To be clear, all of the above applies to dbt just as much as it does to any of the other products above. If you compare dbt-circa-2016 to dbt-circa-2020 you'll find that, while the modern version is far more powerful, the core user experience is very similar. My goal here is not to cast aspersions, but rather to attempt to understand the dynamics of the product ecosystem that all of us are building our careers on top of.
This feels important to me. Humans are tool-building and tool-using creatures---our tooling defines our capabilities, and has, for our entire history as a species. As such, the progress of tooling in this space could not be more relevant to us as practitioners. When I first used Redshift in 2015 I felt like I had been granted superpowers. When am I getting more?
In this post, my goal is to take a look at the modern data stack during three different timeframes:
- Cambrian explosion I, from 2012 - 2016
- Deployment, from 2016 - 2020
- Cambrian explosion II, from 2020 - 2025 I'm going to wear multiple hats throughout this post. My primary hat is that of the practitioner: the analyst who has been building a career in data for over 20 years and has deep experience in every one of these tools. I'll also put on my founder hat from time-to-time, the part of me that has had the opportunity to build one of the major products in today's modern data stack. Regardless of which hat I'm wearing, I'm incredibly excited about the future.
Cambrian Explosion I, from 2012 - 2016
When Fishtown Analytics moved into our new office in November of 2019, one of the first things I did was to hang a painting on the wall. It's a piece of modern art from the 70's called Redshift, and I bought it in an auction on Everything But The House because I loved the name. In my opinion, the modern data stack catalyzed around the release of Amazon Redshift in October of 2012, and hanging this massive painting at the entry to our office memorialized its historic importance.
Take a look at the dates with which the core products in the other layers of the modern data stack were founded:
- Chartio: 2010
- Looker: 2011
- Mode: 2012
- Periscope: 2012
- Fivetran: 2012
- Metabase: 2014
- Stitch: 2015
- Redash: 2015
- dbt: 2016
Or, here's another view of a related dataset: the cohort data on total funding raised by a few of these companies. You can see that 2012 really kicked things off.
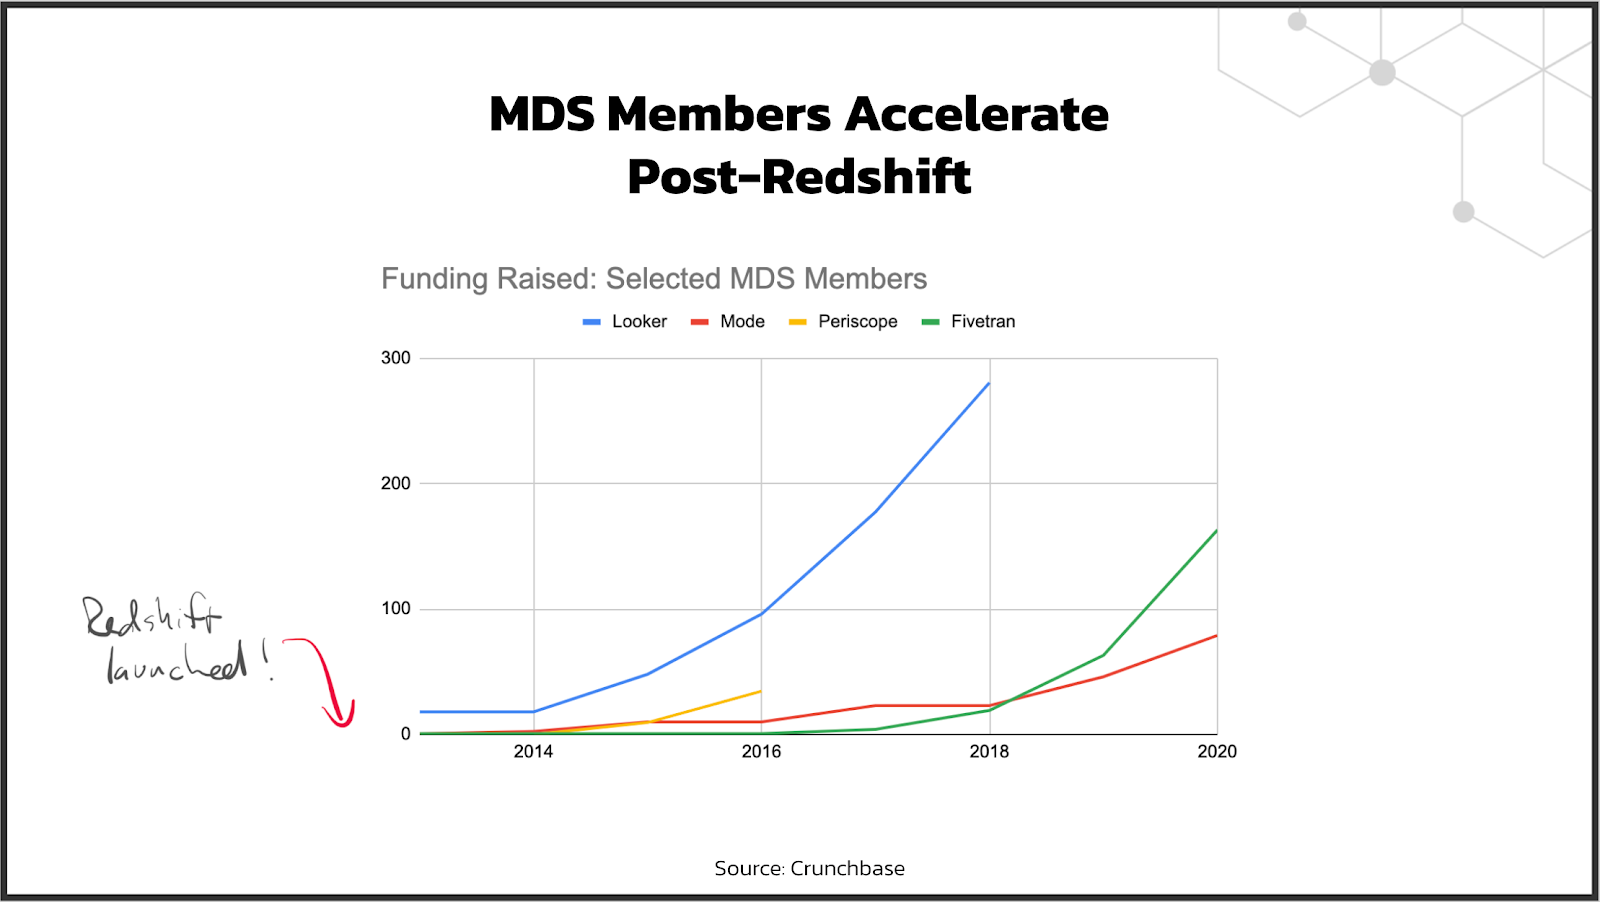
While several of these products were founded prior to Redshift's launch, the launch is what made their growth take off. Using these products in conjunction with Redshift made users dramatically more productive. Looker on Postgres is fine, but Looker on Redshift is awesome.
This night-and-day difference is driven by the internal architectural differences between MPP (massively parallel processing) / OLAP systems like Redshift and OLTP systems like Postgres. A complete discussion of these internals is beyond the scope of this post, but if you're not familiar I highly recommend learning more about this, as it shapes nearly everything about the modern data stack today.
In short, Redshift can respond to analytical queries, processing many joins, on top of huge datasets, 10-1000x faster than OLTP databases.
While Redshift is a very capable MPP database, it wasn't the first. MPP databases had been popularized the prior decade, and many of those products had (and have) fantastic performance. But Redshift was the first cloud-native MPP database, the first MPP database that you could buy for $160 / month instead of $100k+ / year. And with that reduction in price point, all the sudden the floodgates opened. Redshift was, at the time, AWS' fastest-growing service ever.
10-1000x performance increases tend to change the way that you think about building products. Prior to the launch of Redshift, the hardest problem in BI was speed: trying to do relatively straightforward analyses could be incredibly time-consuming on top of even medium-sized datasets, and an entire ecosystem was built to mitigate this problem.
- Data was transformed prior to loading into the data warehouse because the warehouse was too slow (and constrained) to do this heavyweight processing itself.
- BI tools did lots of local data processing to end-around the warehouse bottleneck to give users acceptable response times.
- Data processing was heavily governed by central teams to avoid overwhelming the warehouse with too many end-user requests. Overnight, all of these problems just went away. Redshift was fast, and cheap enough for everyone. This meant that the BI and ETL products who had built businesses around solving them immediately became legacy software and new vendors arose to build products more suited for the new world. Entrepreneurs saw opportunity and flocked to the space, and these products are the ones that largely define the world that we live in today.
Before wrapping up this section, I want to just say that my statements about Redshift's historical significance shouldn't be taken as a stance on which the best data warehouse is today. BigQuery didn't release standard SQL until 2016 and so wasn't widely adopted prior to that, and Snowflake's product wasn't mature until the 2017-2018 timeframe (IMHO). In fact, if you looked at a breakdown of usage between the three products circa 2016 I think you'd see Redshift's usage as 10x the other two combined. So, for those of us building products in the modern data stack, Redshift was the ocean from which we evolved.
Deployment, from 2016 - 2020
If Redshift launched so much innovation from 2012-2016, why did things start to slow down? This has been something I've been mulling over since 2018, when I first started to viscerally feel this decline in the rate of change. I realized that the stack of products we were recommending to our consulting clients had stayed the same since the day we started Fishtown Analytics, which really bothered me. Were we missing out on some groundbreaking new products? Were we getting stale?
It turns out that this is a normal cycle for industries to go through. A major enabling technology gets released, it spurs a bunch of innovation in the space, and then these products go through a deployment process as companies adopt them. You can watch this happen in the very largest technological shifts ever. In fact, I just searched "cumulative miles of railroad track," grabbed some data, and voila!---an S curve:
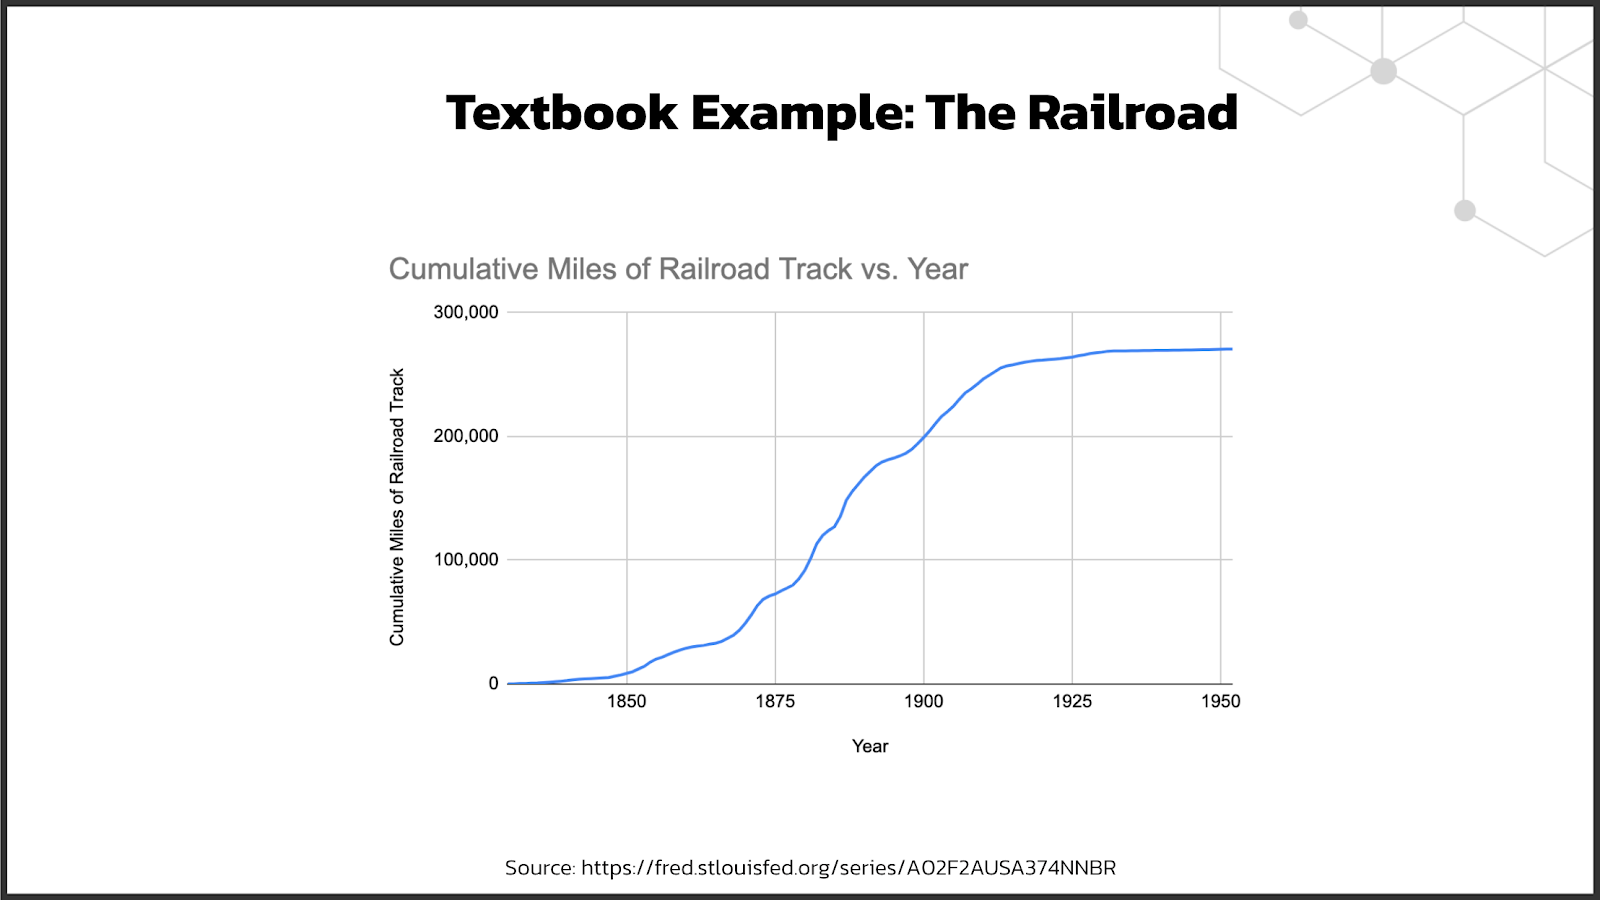
Each technology individually goes through its own "S" curve, from development to deployment, and as each round of technologies begins to mature it both attracts new customers and becomes more technologically mature.
This process, most effectively described by Carlotta Perez in her foundational 2010 paper, happens over and over, writ large and small, as technological change ripples through the world.
What we saw from 2005 (when Vertica was released) and 2012 (when Redshift was released) was the early development phase for the MPP database---the beginning of its S curve. And from there, it's gone warehouse >> BI >> ingestion >> transformation. Note that we are still in the early days of this deployment curve!
When I inspect this theory as a user, it checks out. I can tell you from first-hand knowledge that the experience of using literally every one of the products I listed above has improved dramatically over the past four years. Yes, Fivetran and Stitch still move data from point A to point B, but their reliability has improved dramatically, as has their connector coverage. The same is true for the other layers of the stack as well. dbt, whose path I know quite well, has been completely rearchitected since 2016 to be more modular, more performant, and more extensible---all this while not changing the fundamental UX.
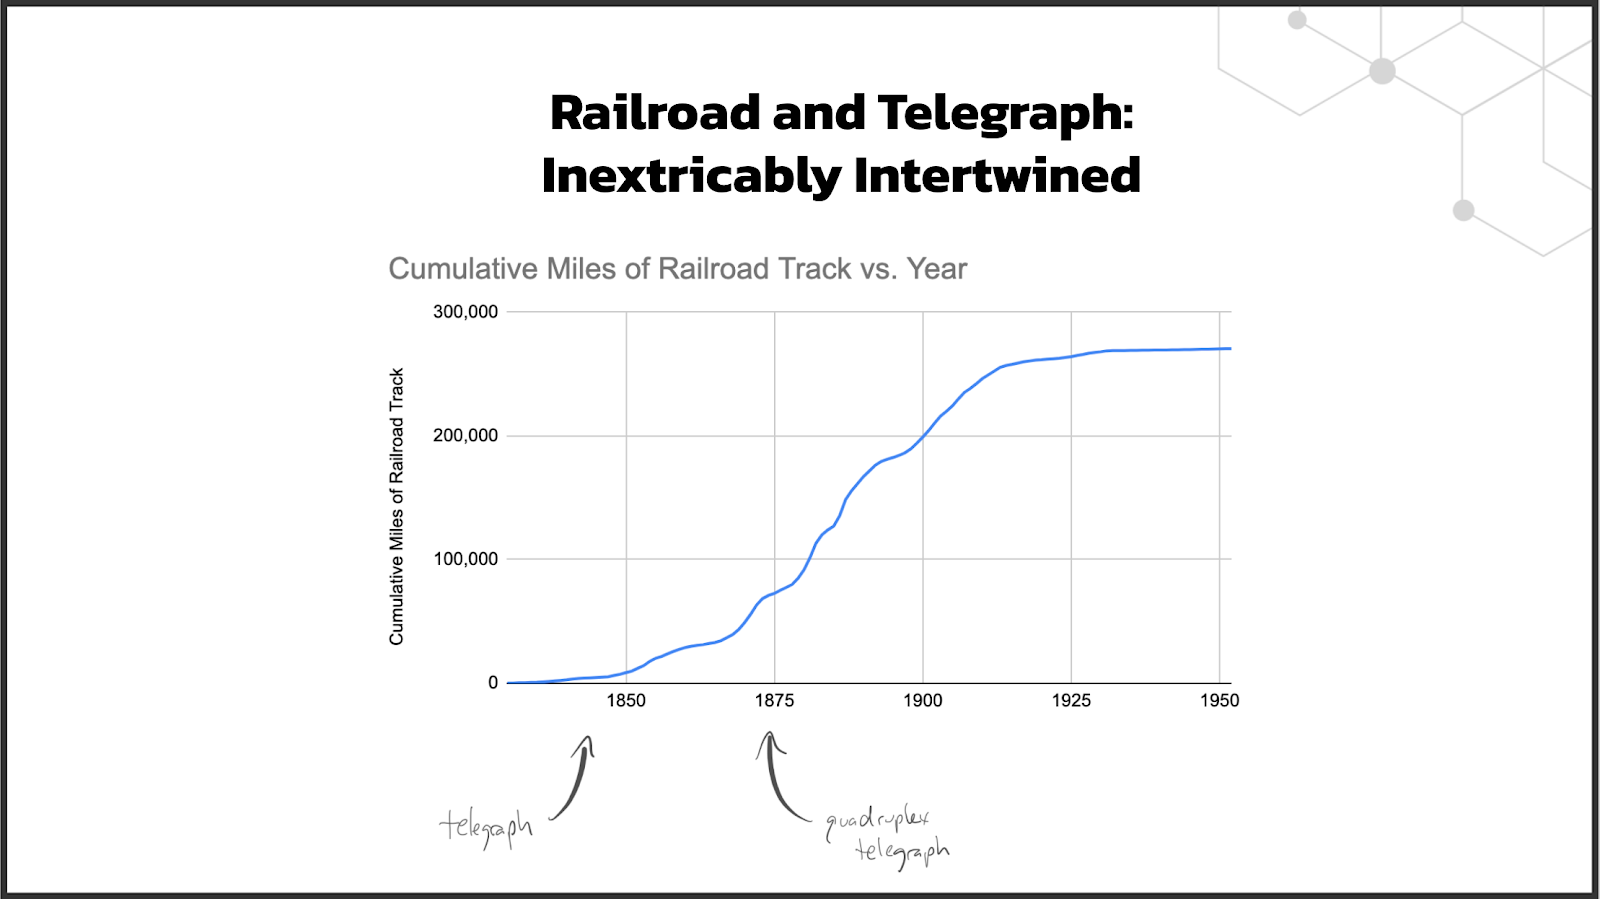
This is what it looks like to traverse up the S curve. Early adopters are forgiving, but technologies need to improve to be adopted by larger and larger audiences. The telegraph went through the same thing: Thomas Edison invented a telegraph multiplexer in 1874, thereby enabling Western Union to quadruple the throughput of its existing lines. Same telegraph, more throughput.
Seen through this frame, this is actually quite exciting. We're seeing these foundational technologies mature: to extend their coverage to more use cases, to become more reliable. These are exactly the things that need to happen to enable the next wave of innovation in the modern data stack, which will be unlocked by these now-foundational technologies.
Cambrian explosion II, from 2021 - 2025
Let's summarize real quick. We saw a tremendous amount of innovation immediately following the launch of Redshift in 2012, unlocking brand new levels of performance, efficiencies, and new behaviors. We then saw a maturation period as these nascent products were deployed by the market, improved their technology, and rounded out their feature sets. By now, these products are ready to act as a foundation on which successive innovations can be built.
So: we're poised for another wave of innovation, another Cambrian explosion. What types of innovations will that bring?
I'm not an oracle, but I do spend a lot of time thinking about this stuff and have lots of conversations with interesting people building and investing in products in the space. I think we can take useful clues from the state of the world today: both the good and the bad. The good aspects represent the places of strength, our solid foundation to build on, while the bad aspects represent opportunity areas.
I believe that we can start to see the seeds of most of these changes happening already. Let's take a look.
Governance
Governance is a product area whose time has come. This product category encompasses a broad range of use cases, including discovery of data assets, viewing lineage information, and just generally providing data consumers with the context needed to navigate the sprawling data footprints inside of data-forward organizations. This problem has only been made more painful by the modern data stack to-date, since it has become increasingly easy to ingest, model, and analyze more data.
Without good governance, more data == more chaos == less trust.
While there have been commercial products in this space for some time (Collibra and Alation are most often cited), they tend to be focused on the enterprise buyer and therefore haven't seen the broad adoption that is true for the rest of the modern data stack. As such, most companies don't use a governance product today.
I've written a lot about this topic, as it's one that's very adjacent to the work we do with dbt. dbt actually has its own extremely lightweight governance interface---dbt Docs---and we anticipate doing a lot of work to extend this existing functionality in the coming years.
Our interest in this area was very much inspired by the work done inside of Big Tech. Many big tech companies have built internal data governance products that are quite good:
- Linkedin has DataHub
- Lyft has Amundsen
- WeWork has Marquez
- Airbnb has Dataportal
- Spotify has Lexikon
- Netflix has Metacat
- Uber has Databook
(I'm sure I'm missing some here, so my apologies if you're affiliated with a project that I didn't name.)
More than a couple of the folks who have been involved in these projects have since left the service of their Big Tech employer to commercialize their work. There is also broad VC enthusiasm for this trend. This combination is a recipe for innovation.
🗓 If you want to go deeper on this topic, Drew will be leading a discussion on metadata at Coalesce next week.
Real-Time
If you're just building dashboards to ask analytical questions, you may not care about the real-timey-ness of your data. In fact, getting new data once a day may be entirely adequate to answer questions about revenue, cohort behavior, and active user trends. But there are actually many potential use cases of the data infrastructure that we're building as a part of the modern data stack that go far beyond what are commonly thought of as "data analysis". Here are a few examples:
- In-product analytics You may want to build dashboards inside of your own product to build useful reports for your users.
- Operational intelligence You may have employees responsible for the core operations of your business who need to know the state of the world right now. Inventory and logistics are very common needs in this domain. 🗓 This was an important factor for JetBlue, you'll likely hear Ashley cover this in her Coalesce talk...or ask her about it during speaker office hours in Slack.
- analytics, but what if you could pipe that data back into your CRM or messaging platforms and trigger downstream events on top of it? This is a huge area of opportunity, and I'll talk more about it in the next section.
So, it's certainly true that real-time data isn't necessary for the primary use cases of the modern data stack today, but reducing the whole-pipeline latency down to 15-60 seconds could unlock brand new use cases for this technology. Ultimately, the nervous system that powers your operational reports should be the same nervous system that is powering these other use cases.
And we're starting to get signals that the technology here is within reach. Each of the major data warehouses has initial support for constructs that enable more real-time-y flows: Snowflake is leaning heavily on its streams functionality and Bigquery and Redshift both are emphasizing their materialized views. Both approaches move us in the right direction, but from what I can tell neither gets us all the way there today. Innovation on this front from all three providers continues.
Another interesting thread here is KSQL, a streaming SQL construct on top of a Kafka. This is certainly interesting and promising, but there are some limitations around the SQL that can be executed (especially with regard to joins), so for me it also falls into the "not quite there" pile.
In the new product arena, I'm excited about a product called Materialize. It's a Postgres-compatible data store that natively supports near-real-time materialized views, built from the ground up on top of stream processing constructs.
Finally, even if the database itself supports real-time processing, ingestion also needs to be real-time. That's why I'm excited about a product called Meroxa---plug and play CDC from relational data stores and webhooks. Products like this will be a critical unlock to get us to a streaming world; no one wants to stand up and administer Debezium.
We're not quite there, but you can start to see the writing on the wall. This thing is going to start coming together over the next few years, and it's going to be awesome.
Completing the Feedback Loop
Today, data flows from operational systems into the modern data stack where it is analyzed. From there, if that data is going to drive any action whatsoever, it's going to have to proactively be picked up and acted on by a human. What if the modern data stack didn't just empower data analysis, but actually directly fed into operational systems?
There are a huge number of potential use cases here. I'll just list some very basic ones:
- Customer support staff spend all of their time inside of the help desk product used at their company. Pipe in key user behavior data from your warehouse directly into the help desk product to make it available to agents as they help customers.
- Similarly, sales professionals spend all of their time inside of their CRM. Feed product user activity data directly into their CRM interface to enable them to have more context-rich conversations.
- Rather than dealing with a myriad event tracking implementations, feed your core product click stream directly into your messaging products to trigger automated messaging flows.
There are so many more---I truly believe that the obvious use cases here are only going to be the tip of the iceberg. What this trend is actually going to unlock is the ability for data / business analysts to program the entire business. And while real-time makes everything about this trend more powerful, even end-to-end latency of a few hours can still be adequate for many of these use cases.
I've been writing hacky scripts to facilitate this type of data movement since 2014, but we're finally starting to see tools in this space getting some traction. Census and Tray are the ones I'm most familiar with, but I'm sure there are others that I don't know about.
If you're writing dbt code today, assume that in the fairly near future this code will not only power internal analytics, it will power production business systems. This will make your job both more challenging and more exciting.
Watch this space---this will happen quickly.
🗓 If you want to go deeper on this topic, join The Future of the Data Warehouse at Coalesce next week.
Democratized Data Exploration
Here's a potentially controversial opinion. I think that decision-makers---you know, the people who are actually responsible for making the operational decisions that data informs---have not been well-served in the modern data stack. Executives? Sure, they get amazing dashboards. Analysts? Absolutely. But there are a large number of people (like, hundreds of millions) whose primary professional tool is Excel, and I believe that their experience of data has actually gotten worse with the advent of the modern data stack. All the sudden they're locked out from participating.
I know this sounds weird, but at one point, Excel was production. On network drives, you could reference one workbook from another, and could end up creating powerful data systems. Of course, it was all incredibly brittle, insecure, and error-prone, so trust me I'm not suggesting that we should recreate it. But, I really do believe that a very large number of data consumers were more empowered in that environment than they are in today's.
Certainly there are lots of options that non-SQL-using data consumers have today. All of the primary BI tools have some type of interface to facilitate exploration of data without needing SQL. But absolutely none of these (including LookML, sadly!) have come even remotely close to the level of widespread adoption or sheer creative flexibility as Excel. As a demonstration of stickiness of the paradigm, you will often observe data consumers exporting data from their BI tools into Excel workbooks and then continuing to play with it there (much to the chagrin of their data team colleagues).
The challenge here is non-trivial. Without a powerful, flexible tool for data consumers to self-serve, the promise of the modern data stack will forever be for a select few. This is a bad outcome.
Here's another controversial statement: what if the spreadsheet is actually the right answer? It's a well-understood, powerful, flexible user interface for exploring data. The problem is that the spreadsheet UI hasn't been brought into the modern data stack yet. What would that look like?
I've seen two promising candidate ideas. First, bring the data to the spreadsheet. Almost every BI product can do the bad version of this: "download as Excel". But this is not a good solution---it immediately cuts off your spreadsheet from the rest of the data infrastructure. As I mentioned before, interlinked spreadsheets and live updating was always a critical aspect of the prior Excel-based status quo.
The better version of this looks more like a "sync with Google Sheets" process, whereby the spreadsheet maintains its link with the data source and data is updated on some periodic basis. The user can then build on top of the source data in additional tabs. The best implementation of this approach that I've seen is a product called SeekWell. It's promising.
The second candidate idea is to use the spreadsheet to build formulas that get compiled down to SQL and run against the database. Essentially, your spreadsheet interface because just another UI to query data directly in the warehouse, but one that is more broadly understood by data consumers. This approach is best exemplified by a product called Sigma Computing, and you can see it in action here. Ultimately it doesn't achieve full spreadsheet-y-ness because you're constrained to sticking to the very constrained one-formula-per-column paradigm, but I think it's an interesting take on the problem nonetheless.
All of this said, I'm not positive that the right answer to data consumer exploration is spreadsheets---I think it's a promising avenue, but there are certainly downsides as well. What I do feel extremely confident about is that data consumer self-service exploration is going to be solved in the next several years. We're going to see a tremendous amount of experimentation and iteration around this idea, because the pain point is too obvious and the commercial opportunity is too large.
There is no technical hurdle to be solved here---the building blocks are all in place. The hard part is figuring out the UX.
Vertical Analytical Experiences
There was a huge, glaring problem with the 2012-era web analytics world, where Google Analytics, Mixpanel, and KissMetrics were the only games in town: they were data silos. The only way that you could access data from these tools was via their GUIs, and you couldn't join it with data you had elsewhere. If you did want to incorporate data from other systems, you had to push it in as an event, thus leading to duplicate data. Anyone who has run an even-remotely-mature data organization knows what a cluster this becomes.
This era led to a profusion of different verticalized data stores that had their own copies of data which was locked inside of a proprietary interface, and it is this profusion of data sources that drove much of the demand for data warehousing. BUT! We've thrown the baby out with the bathwater.
There is a tremendous amount of value in verticalized analytical experiences. An analysis tool that sees your data as a series of web events will be able to present smarter options to you than a tool that just sees rows and columns. Google Analytics is a more powerful tool---for analyzing web traffic data---than are any of the BI tools in the modern data stack. This shouldn't be surprising.
So which is better, horizontal tooling that treats all data as rows and columns, or verticalized tooling that is purpose-built to analyze a specific type of data? The answer is: we need both. But the thing we're missing today is verticalized analytical interfaces built on the modern data stack. We need a product like Google Analytics that, instead of plugging into Google's proprietary back-end, plugs into your data warehouse. You tell it where to look for your events table and call out the key fields---user id, timestamp, session id, etc---and then it allows you to explore it by compiling all of your interactions with the interface down into SQL.
This was not a realistic way to build an analytics product back in 2012, but today, with fast warehouses, standardized ingestion tools, and open source modeling with package management built in, you could realistically imagine telling your users "point me to your web analytics data" and they could actually do that. All the sudden you're not working off of a silo or suffering through a suboptimal exploratory experience: you get the best of both worlds.
My belief is that as the set of companies using the modern data stack increases, the opportunities for new, lightweight, verticalized applications like this to be built will grow significantly. It's already a direction you can see Looker headed in with its app marketplace, but I think the opportunity is much bigger than just the set of Looker users out there. My guess is that companies will be built around single products built in this way, just like Google Analytics was in the prior era.
A useful narrative?
The above narrative is what I've come to after thinking about this topic for two full years now. I certainly don't believe that any specific prediction I've made will necessarily come true, but I do believe that the overall narrative is both directionally correct and useful.
As the industry goes through waves of development and deployment---waves that impact every single practitioner in the space---keeping this map in your head is a good way of orienting. Periods of rapid change are pregnant with possibility for both individuals and companies, and I think we're seeing another one starting.
Get started in dbt
Join the analytics engineers building data infrastructure that actually scales.
Install dbt Wizard CLI
Get started with an agent purpose-built for analytics engineering. It knows which tool to call, which context to pull, and checks its own work before surfacing anything to you.