How We Rebuilt the dbt Cloud Scheduler

last updated on Sep 11, 2024
In the first installment of this post, Julia shared some background on why we decided to rebuild our scheduler to keep up with growing customer demand. This accompanying post is written by and for engineers interested in tackling distributed system problems. We'll share details on the architecture we started with, the technical decisions we made along the way, and a preview of problems we're still thinking about.
How We Started
Before we embarked on this journey, our scheduler was implemented using a continuous loop that ran in one process. There were three main components in our scheduler: the Queuer, the Dispatcher, and the Runner which we'll describe below. This simple design served us well for quite some time, but as the number of runs that dbt Cloud executed grew, the performance deteriorated.
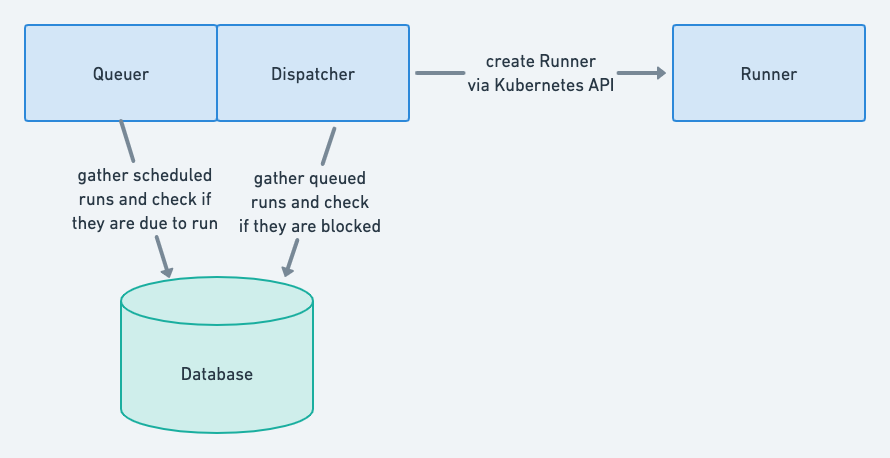
An overview of the original scheduler architecture. Details the interactions between the different components that are described in this section.
The Queuer was responsible for looking up active, scheduled job definitions, inspecting the configured cron schedule, and determining if a run needed to be queued based on that cron schedule. This approach looked at every job definition, each scheduler loop. As you can imagine, the scheduler spent a lot of time evaluating job definitions that were not meant to run for quite some time – hours if not days away from the next run.
Once the Queuer moved a run into a queued state, then the Dispatcher would gather up all of the queued runs, determine if they could be run based on some business logic, and then finally call the Kubernetes API to spin up resources to execute the run.
Finally, after a Kubernetes pod was created via the Kubernetes API, the Runner would take over. We won't dive into this component too much, but at the most basic level, the Runner is in charge of executing the dbt commands that are associated with a job definition.
Because each step was tightly coupled and executed in sequence, we knew there was little hope in getting significant performance gains with the original scheduler. We needed a system that could scale horizontally, so we got to work designing a scheduler more suitable for our needs.
A Scale Out Solution
We wanted dbt Cloud's scheduler to flexibly scale out as the number of job definitions and runs grew. After digging into some of the data, we decided that the Queuer was the first component that we needed to tackle. Looking at the average run times, it was one of the slower components in the system. It was also the first code that ran in the existing scheduler's code path and a natural place to start.
Implementing Go Workers to Queue Runs
We decided to move the Queuer component out of Python and into Go. Go's concurrency primitives are great, and we benefited from this throughout the project. It made concurrent operations and co-routines much easier to work with.
We decided to break the Queuer into two new components – the Orchestrator and Workers. The Orchestrator is responsible for telling the Workers which job definitions they should manage, and also sending updates to the Workers when job definitions change. The Workers manage the job definitions that the Orchestrator has tasked them with, and then they queue the jobs to run according to their cron schedule.
The Orchestrator watches the database for changes to any entity that would affect how a job definition is scheduled. If a job setting changes, the Orchestrator will send out a message to let the Workers know that an update has occurred. From there, the Worker is expected to apply that update to their internal cron queue. We monitored the latency in this process, as it's important that the state in the Workers is not vastly different from what is in the database. This was a tradeoff we made in order to significantly reduce the number of database queries that the Workers make.
The Workers are using an open source library aptly named cron to manage the job definitions. This library implements a cron scheduler by using a priority queue, which is common in modern cron implementations. The main advantage is the head of the queue is the next job that needs to be run. Because of this property, the cron scheduler can essentially go to sleep until that next job needs to start. This is a vast improvement over our original design which was looping over each job definition at the beginning of each scheduler loop.
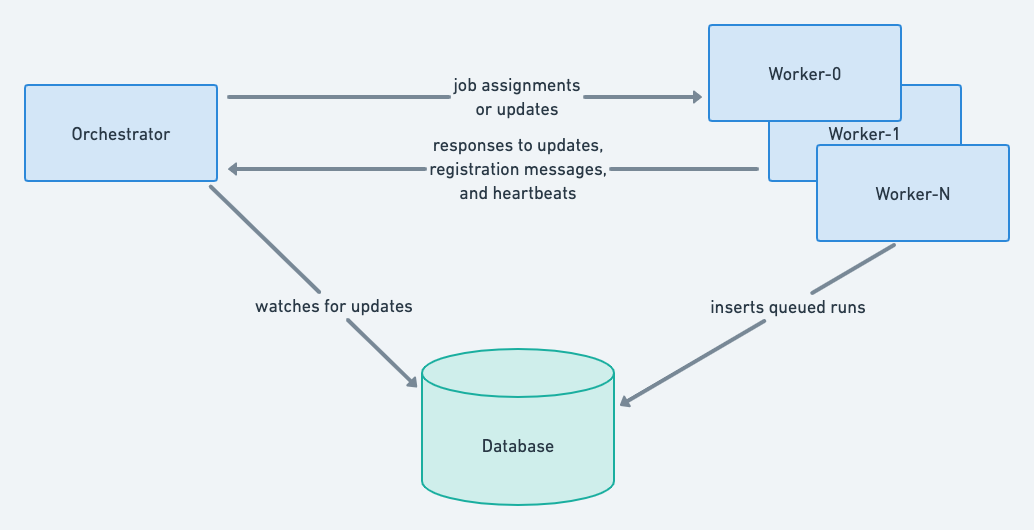
An illustration that captures the basic flow of messages being passed around between the Queuer Orchestrator and the Queuer Workers.
All communication is done via message queues. When adding job definitions to Workers, a single queue is used which all of the Workers read from. This makes load balancing job definitions across Workers fairly straightforward because the job definitions are round robined. Each Worker also has their own message queue to subscribe to job definition updates. Updates are meant to go to a specific Worker responsible for overseeing a particular job, so separate queues are appropriate.
Messages are not guaranteed to be temporally ordered across queues, so the messages need to be ordered on the receiving end to ensure updates are applied correctly. This problem is solved by using a logical clock in conjunction with a term (which is sometimes referred to as a generation). Each time the Orchestrator starts up or restarts, it increments the term, stores the new value, and resets the logical clock to zero. The advantage to using a term is that only one value ever needs to be persisted between Orchestrator instances, and less I/O is needed when updating the logical clock's value. Every message increments the clock and sends the logical timestamp plus the term alongside the message contents to the Workers.
With this system in place, we can increase the number of Workers that are running which allows us to lower the number of managed job definitions per Worker. Because we have heartbeating in place, the Orchestrator can detect a failing Worker and shift its job definitions over to another Worker. This architecture improves our fault tolerance and allows us to horizontally scale the number of resources.
One issue you may be thinking about is: what happens if two Workers are somehow managing the same job definition? Without any other protections in place, it would be possible for a run to be queued multiple times. However, we added what we call an "idempotency key" to the run records in the database. This is a deterministic string which can be generated given a job definition identifier and an invocation time (as a UNIX timestamp). We added a uniqueness constraint on this column so that a single invocation of a cron schedule could never accidentally be queued multiple times in our database.
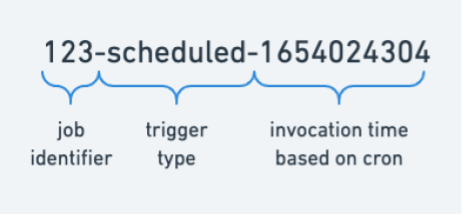
The anatomy of an idempotency key.
Stretching Python to Process More in Parallel
The next step in the life of a run in dbt Cloud is handled by the Dispatcher. In the original design, we had no way of scaling this piece horizontally. Each queued run was processed in sequence, which was problematic at peak times (ex. midnight UTC).
Unlike the Queuer component, we didn't do a full rewrite of this code. The Dispatcher houses much of the dbt run's business logic unique to dbt Cloud, and we kept a lot of that code intact. However, we did rework this component so that we could run many Dispatchers in parallel.
To achieve this, we kept part of the scheduler loop running. The scheduler loop will now periodically scan for any queued runs, and send out what we call a "pickup" message to a fleet of listening Dispatchers. With our message queue, we get load-balancing for free, so we don't have to worry about one Dispatcher getting overloaded.
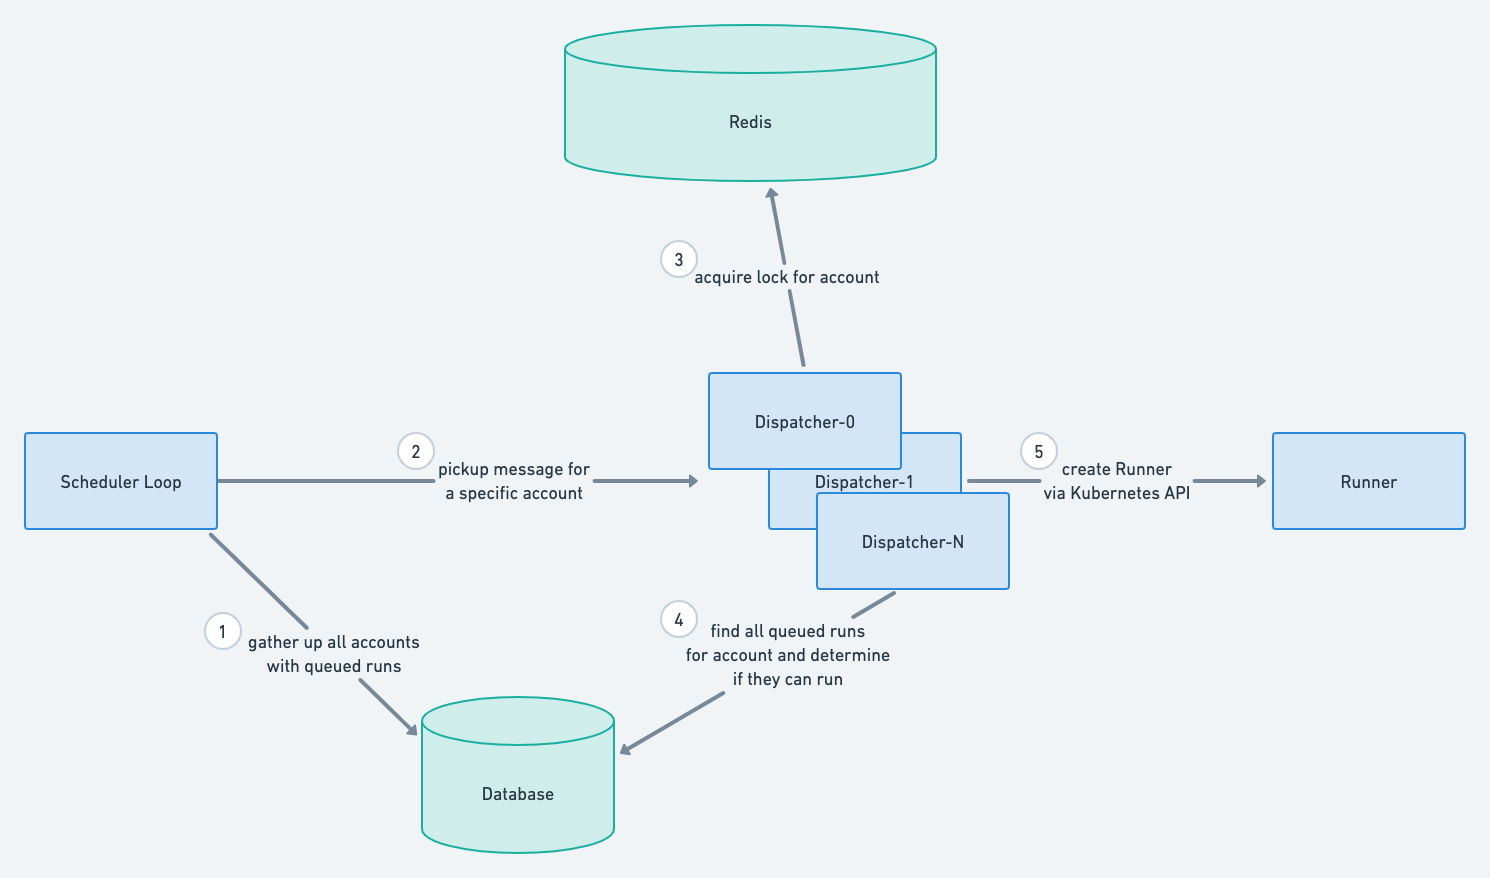
A diagram that depicts the sequence of events that happen in the Dispatcher. Each event is described in this section.
From here, the Dispatcher checks some business logic to make sure that these runs are not blocked by a lack of purchased run slots or a still-active run of the same job. If a run passes these checks and is not blocked, the Dispatcher calls out to the Kubernetes API to create the necessary resources. If a run is blocked, then the Dispatcher does nothing. The next time the scheduler loop comes around, it will send out another message which will re-trigger the same business logic checks.
With this design, we had to handle a potential race condition. We didn't want the same dbt Cloud account to be processed by multiple Dispatchers at the same time. This could lead to duplicative runs being started. To ensure that only one Dispatcher is operating on an account at a time, we used a distributed lock which is managed by Redis. Each Dispatcher must acquire the distributed lock for the account before processing the pickup message. If it cannot acquire the lock, then it drops the message and assumes that another Dispatcher is already working on handling the runs for the account in question.
Along with all of these architecture changes, we also reviewed the most used SQL queries in this code path. We made meaningful performance improvements by reworking some queries entirely or by tweaking the indexes we had in place. This code path is executed very frequently, so it was important to make this process as fast as possible.
Fighting with EKS to Scale
Once the Dispatcher calls out to the Kubernetes API, then the onus is on Kubernetes to spin up the necessary resources to execute the dbt Cloud run. After making the Queuer and Dispatcher faster, we noticed there was significantly more load on Kubernetes, and it became clear it was our new performance bottleneck.
Kubernetes has its own scheduler called kube-scheduler. Originally we were using Jobs to manage resources in Kubernetes. However, Jobs in Kubernetes are managed by a separate controller, which was slower than we had hoped. The first thing we did was create Pods directly to bypass the Job controller. This resulted in a significant decrease in latency between when the API calls were made and when the Kubernetes Pod was ready and running.
We didn't stop there though. Even with the change of using Pods instead of Jobs, the overall run delay was still quite high at peak times. The next step was to split runs across multiple EKS clusters. Because of the way that the Dispatcher was now designed, it was much easier to start executing runs in another cluster. All we needed to do was run some Dispatchers in the other EKS cluster and distribute the load evenly. This change resulted in nearly halving our run delay metric.
What's left to do
There are still more improvements to make! While we are happy with our performance now, the slowest part in our system comes from allocating and starting up resources in our Kubernetes clusters. We're looking into how we can keep a pool of warm resources around to eliminate the latency involved with spinning up Kubernetes' resources.
Results!
It wouldn't be a dbt Labs post without some data. Below is a dashboard that our team monitors closely.
The color key:
- Red represents % of delayed runs that are over 60 seconds behind their cron scheduled time.
- Light green represents % of fast runs that take fewer than 25 seconds to kick off.
- Dark green represents % of runs that take between 25 and 60 seconds to kick off.
Our team considers a run "on time" if its prep time is less than or equal to 60 seconds, and "delayed" if its prep time is greater than 60 seconds.
We went from only 21% of runs being "on time" at the beginning of the year to 99.99% currently – a pretty decent payoff for our efforts!
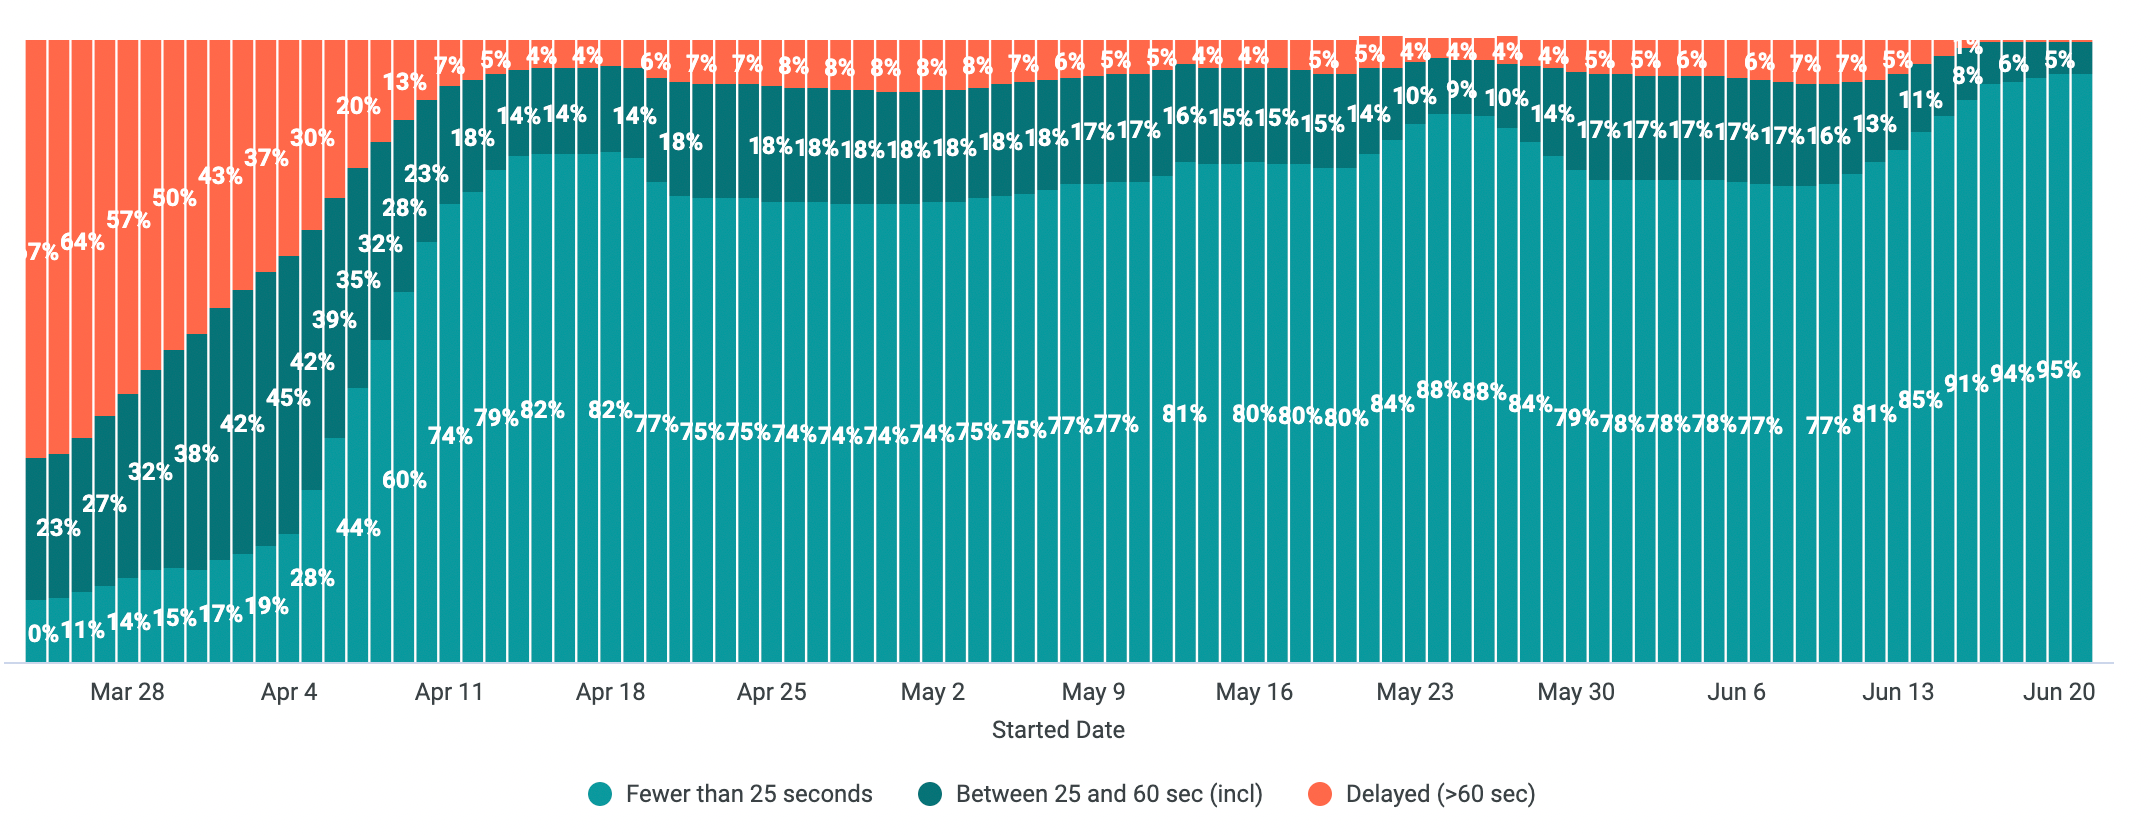
A graph of our run uptime metric between the beginning of March 2022 and mid June 2022.
This was a fun but challenging project for our team. We rethought how our scheduler should work, and we introduced some new technology along the way. During this process we learned a lot about Kubernetes and identified a few limitations based on our usage patterns. Huge thanks to our Infrastructure team for helping us dive into metrics and understand the health of our Kubernetes cluster. Much of the later work discussed in this blog post was made possible by their hard work and guidance.
We hope that this overview of our scheduler provides some good technical insight into the improvements we made over the last few months. If this kind of work excites you, consider applying for an engineering role at dbt Labs! We're the Shipments team, and we have many more exciting technical problems to solve.
VS Code Extension
The free dbt VS Code extension is the best way to develop locally in dbt.


