How the dbt Semantic Layer works

Last edited on May 04, 2026
We recently published a blog post that walks through the five key benefits of the dbt Semantic Layer (if you haven’t read it, check it out!). You might be thinking to yourself: consistent metrics, empowered stakeholders, and simplified code sound great…but how does it really work? Well, you’ve come to the right place. This is part two where we'll delve into the technical components of the dbt Semantic Layer. We'll answer questions such as: What are semantic models? How do you construct metrics? How are semantic layer queries executed? Is it magic? (spoiler alert: it's not, but it is fascinating). Let's dive in!
And if you missed our GA launch of the dbt Semantic Layer at Coalesce 2023, you can catch the replay below:
Framing our example
In this post, we’ll walk through the individual steps a user would go through to configure their dbt Semantic Layer semantic models and metrics. We’ll also explain how the dbt Semantic Layer APIs work to support a robust ecosystem of analytics tools so data consumers can query data from their preferred environment. Finally, we’ll peek under the hood of MetricFlow to show how a user request for a specific metric flows through the dbt Semantic Layer and ultimately delivers (consistent, governed, tested!) data to that end user.
We’ll be using the familiar Jaffle Shop dataset throughout our example (you can follow along with the code in the linked template, or copy/paste the code snippets included throughout this post!), which is a store that sells food and drinks. Among other insights, our downstream data consumers want to understand revenue, order costs, and customer order patterns.
Components of the dbt Semantic Layer
The dbt Semantic Layer has a few key components that correspond to a generalized workflow, which we’ve broken out below:
- Defining semantic models and metrics with the MetricFlow specification: the YAML spec that MetricFlow takes which describes your data
- Semantic layer APIs and integrations: the consumption interfaces and tools to query your metric data
- Query generation: MetricFlow’s optimized SQL query creation, which computes the requested metric output
But first, what is MetricFlow?
You've probably heard that the dbt Semantic Layer product is powered by MetricFlow. Originally created by Transform (which dbt Labs acquired in early 2023), MetricFlow is now a crucial component of the dbt Semantic Layer. MetricFlow is responsible for SQL query construction and defines the specifications for dbt semantic models and metrics.
Essentially, MetricFlow uses the information from your semantic model and metric YAML configurations—which you define on top of your dbt models—to construct SQL on the fly at query time and run that SQL in your data platform. We know—this feels like magic, but there’s a lot of moving pieces under the hood to make it happen (…including a MetricFlow wizard with a powerful wand 😉). Let’s dig in to the components of the Semantic Layer and how they work with MetricFlow.
Defining semantic models and metrics with the MetricFlow specification
Semantic models
Semantic models serve as the foundation of the dbt Semantic Layer. These models are built based on existing dbt models, maintaining a one-to-one relationship and comprise key components that describe your data.
1. Semantic model information includes the model name, description, the referenced dbt model (this is a 1-1 relationship), and the default time dimension within the model, which indicates the time series that the metrics should be aggregated. For instance, consider the semantic model named order_item , which describes the items contained from each order:
semantic_models:
  - name: order_item
    defaults:
      agg_time_dimension: ordered_at
    description: |
      Items contained in each order. The grain of the table is one row per order item.
    model: ref('order_items')
2. Entities are the foreign, primary, unique, or natural keys that make up the semantic model, and by relating these entities across semantic models, MetricFlow can perform joins dynamically. Our join rendering intelligently avoids fan-out and chasm joins. You can learn more about how MetricFlow constructs joins here. Entities require a name and type. You have the option to also include an expr definition, in the event that the name you are giving the entity differs from the name in the model. As you can see below, the primary key is order_item (which references a column called order_item_id). Also, there are a few foreign entities in this table. In the example of the foreign entity called product_id, our data will contain a different semantic model where we’ll define product_id as a primary key. These are standard relationships in a star schema, so if you are not using the dbt Semantic Layer, you can write a manual join query to join the order_item and product tables together. However, with the dbt Semantic Layer, you don’t need to write the SQL to do that. Instead, with this entity configuration, MetricFlow can create the semantic graph with models as nodes and entities as edges, and perform the joins to get dimensions or calculate metrics across different semantic models automatically.
entities:
- name: order_item
  type: primary
  expr: order_item_id
- name: order_id
  type: foreign
  expr: order_id
- name: product
  type: foreign
3. Measures are the numerical columns that form the basis of your metrics. Using measures as inputs to metrics helps keep our code DRY (Do Not Repeat Yourself) because we can use measures in multiple metrics. In the example below, there are four measures: revenue, food_revenue, drink_revenue, and median_revenue. Each measure requires an aggregation type, which determines how the metric is calculated. Measures require a name and an agg. Optionally, you can provide a description or expression ( expr ) if you want to only aggregate based on certain conditions. The aggregation ( agg ), is one of the crucial elements of the semantic model because it describes how to aggregate the measure that is the building block to the metric, and this is one of the elements of achieving metric consistency.
measures:
- name: revenue
  description: The revenue generated for each order item. Revenue is calculated as a sum of revenue associated with each product in an order.
  agg: sum
  expr: product_price
- name: food_revenue
  description: The revenue generated for each order item. Revenue is calculated as a sum of revenue associated with each product in an order.
  agg: sum
  expr: case when is_food_item = 1 then product_price else 0 end
- name: drink_revenue
  description: The revenue generated for each order item. Revenue is calculated as a sum of revenue associated with each product in an order.
  agg: sum
  expr: case when is_drink_item = 1 then product_price else 0 end
- name: median_revenue
  description: The median revenue generated for each order item.
  agg: median
  expr: product_price
4. Dimensions are the time-based or categorical attributes of your data. In this instance, we have a time dimension, along with two boolean dimensions that indicate whether the order is for food or drink, respectively. Categorical dimensions only require a name and type. Time dimensions also require granularity, and this creates a natural hierarchy and allows us to easily query up and down granularities (e.g, you can traverse from day to month without creating a different semantic model). As with the other components, an expr field can be used to further transform the definition.
dimensions:
- name: ordered_at
  expr: cast(ordered_at as DATETIME)
  type: time
  type_params:
    time_granularity: day
- name: is_food_item
  type: categorical
- name: is_drink_item
  type: categorical
Metrics
After defining your semantic models, the next step is to define some metrics. These metrics can be based on a single semantic model or use measures and metrics across multiple models, thanks to joins.
We support various types of metrics. You have the freedom to define the calculation for the metric and its metadata, such as the description. Metrics require a name, label (for a user-friendly display name), type (the type of metric), and type_params, which differ based on what the metric type is. We strongly recommend adding a description for additional context, although this is optional.
Here are examples of our various metric types and some example definitions:
Simple
These are metrics that point directly to a measure, and these are expressed by noting the measure as the type parameter ( type_params ):
- name: revenue
  description: Sum of the product revenue for each order item. Excludes tax.
  type: simple
  label: Revenue
  type_params:
    measure: revenue
Cumulative
These are metrics that allow you to aggregate a measure over an accumulation window.
There are several ways to define cumulative metrics, depending on your specific goals. These calculations can often result in complex SQL, making MetricFlow's user-friendly interface a simpler alternative for creating these metrics. Here are a few types of cumulative metrics you can define:
1. A running total, where you simply define the measure you want to total over all time. In this case, we’re calculating cumulative revenue:
- name: cumulative_revenue
  description: The cumulative revenue for all orders.
  label: Cumulative Revenue (All Time)
  type: cumulative
  type_params:
    measure: revenue
2. A total over a specific window. You would use this if you want to define common weekly/monthly/daily active user-style metrics. The window parameter specifies the time period you want to accumulate the metric over. In this case, we’re calculating Weekly Active Users.
- name: weekly_customers
  description: Weekly Active Users
  label: WAU Rolling 7
  type: cumulative
  type_params:
    measure: customers
    window: 7 days
3. A total using a grain_to_date. You would use this if you want to calculate a measure starting from a specific grain, like “Revenue - Year to Date .” The grain_to_date parameter describes over what grain to accumulate the metric. In this case, we are calculating the month-to-date (MTD) cumulative order total.
- name: cumulative_order_total_mtd
  label: Cumulative Order Total (MTD)
  description: The month to date value of all ordres
  type: cumulative
  type_params:
    measure: order_total
    grain_to_date: month
Ratio
These are calculated using numerator and denominator to divide two metrics from each other. This is very common in many modeling scenarios. In this case, we are calculating the percentage of food revenue from total revenue.
- name: food_revenue_pct
  description: The % of order revenue from food.
  label: Food Revenue %
  type: ratio
  type_params:
    numerator: food_revenue
    denominator: revenue
Derived
These are defined as an expression ( expr ) of other metrics. Derived metrics offer a lot of flexibility in building out the right metrics for your organization, given how expressive they allow a developer to be. In this case, we are calculating profit by revenue-cost, and you can also use derived metrics to do more advanced calculations.
- name: order_gross_profit
  description: Gross profit from each order.
  type: derived
  label: Order Gross Profit
  type_params:
    expr: revenue - cost
    metrics:
      - name: revenue
      - name: order_cost
        alias: cost
Conversion (new!)
Conversion metrics allow you to define when a base event and a subsequent conversion event happen for a specific entity within some time range. This is incredibly common in marketing analytics. As an example, I can use a conversion metric to answer the following question: how many users visited my website and made a purchase within 7 days of their visit?
 - name: visit_to_buy_conversion_rate_7d
  description: "Conversion rate from visiting to transaction in 7 days"
  type: conversion
  label: Visit to Buy Conversion Rate (7-day window)
  type_params:
    fills_nulls_with: 0
    conversion_type_params:
      base_measure: visits
      conversion_measure: sellers
      entity: user
      window: 7 days
As you can see, many of these calculations will resolve to complex SQL, and comparatively, thanks to MetricFlow, these metric definition interfaces are incredibly simple to use.
Testing your metrics and committing your code
At this point, you’ve defined a number of semantic models and metrics. Before you commit them to your project, you can use the dbt Cloud CLI to test what you’ve defined to make sure it looks as you expect. The Cloud CLI allows you to connect to your dbt Cloud configuration from your local terminal and verify that the metric looks good, like this example query verifying revenue by customer_name. We’ve compiled a helpful guide to show all the workflows available in the CLI.
Once you verify that your data is ready to ship to production, you can invoke a run of your dbt project with all your semantic models and definitions. Then, dbt will produce a file called semantic_manifest.json, which is a run artifact (in your target directory) specific to the dbt Semantic Layer and holds all the information about your semantic data.
dbt Semantic Layer APIs and integrations
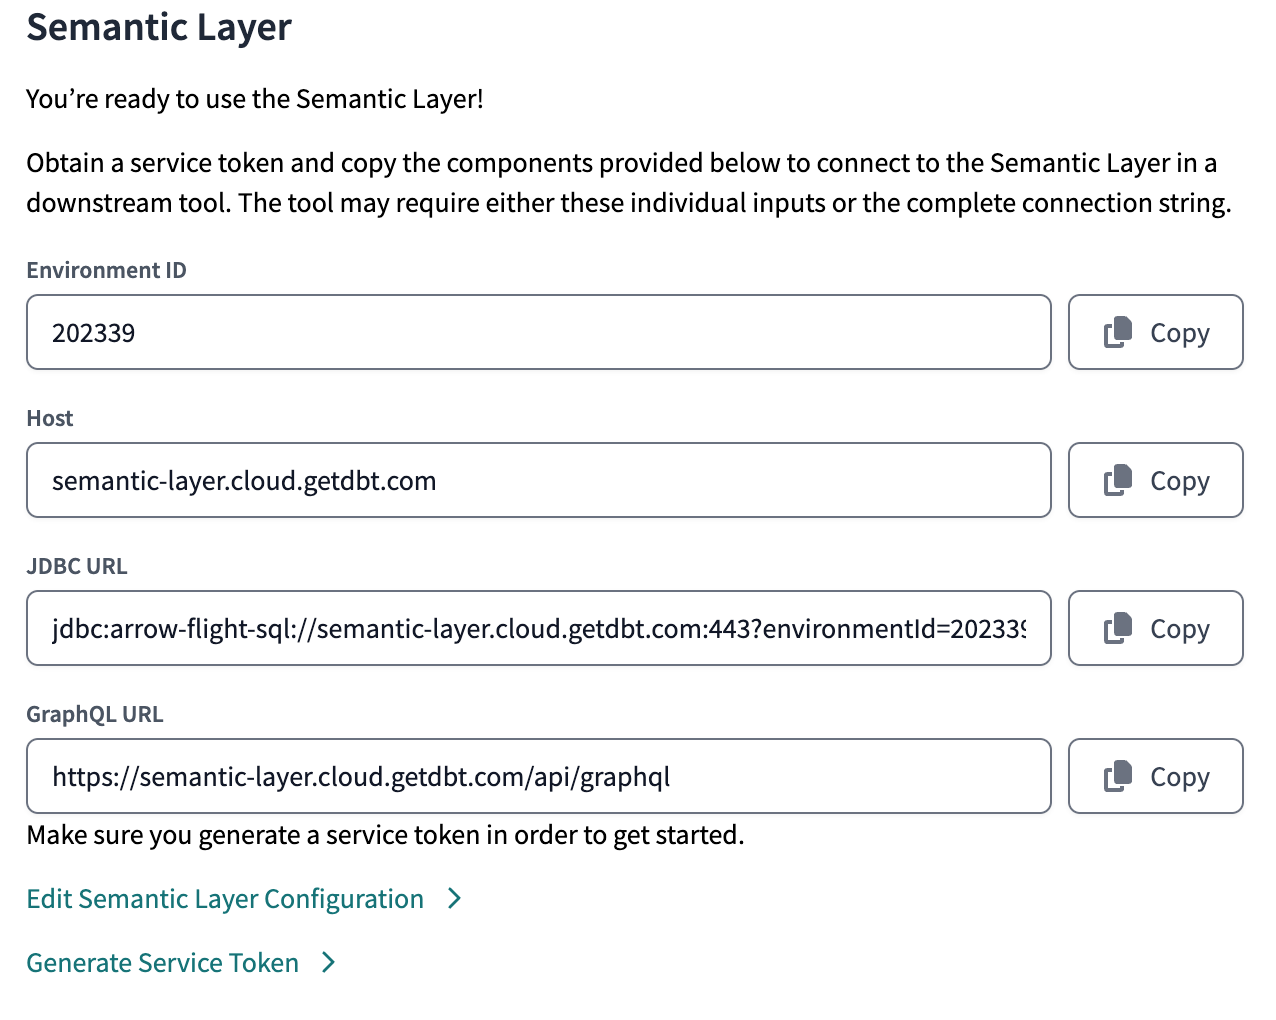
Now that you’ve tested and committed your semantic models and metrics and have run a job, it’s time to make these models and metrics accessible to your downstream data consumers. To do this, you need to configure the dbt Semantic Layer in dbt Cloud, which will allow you to make requests to the dbt Semantic Layer APIs. You configure the Semantic Layer by inputting a set of Semantic Layer-specific credentials. We recommend that these are read-only or less privileged than the ones used to run dbt models. Once configured, you’ll notice that we return information about how to access our APIs. Our APIs authenticate with Host, Environment, and dbt Cloud Service Token.
APIs
We have two APIs: JDBC and GraphQL. These APIs are how the various integrations communicate with MetricFlow. Specifically, they request a set of metrics, dimensions, filters, and more, to be returned. These requests get passed to MetricFlow and allow it to generate the underlying SQL query (more on this in the next section!).
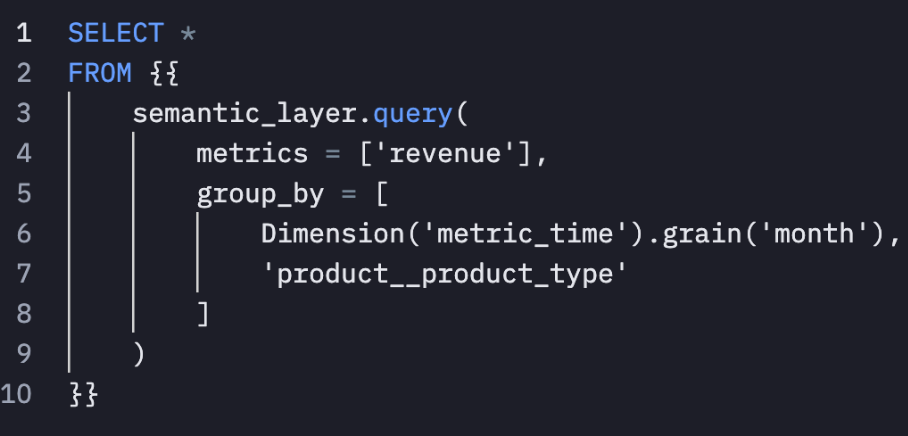
Our JDBC API is based on Apache Arrow Flight SQL and provides a mechanism to query metrics and dimensions in a SQL-like manner. This is not only used by our downstream analytics partners to build their own dbt Semantic Layer integrations, but can also be used in tools that support our driver and writing custom SQL (e.g., Hex, Mode, and common IDE tools like DataGrip and DBeaver). Below is an example from our Hex integration.
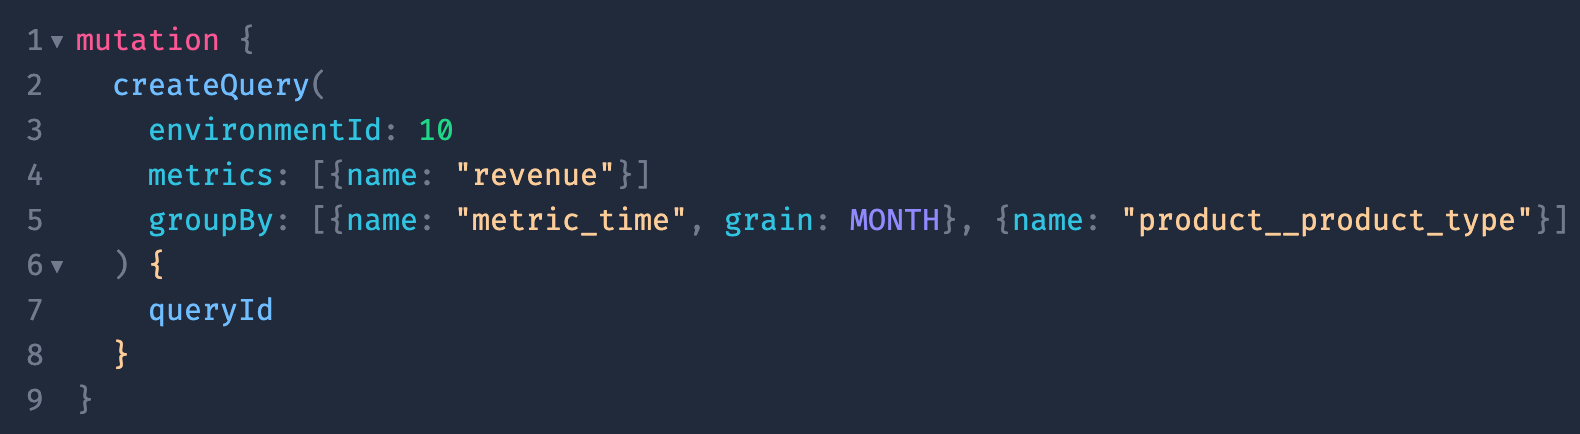
Similarly, our GraphQL API offers similar functionality as far as querying metrics and dimensions, but is a powerful choice for developers who prefer a more structured language and the flexibility of a strongly-typed interface. Below is an example of querying the same metrics and dimensions from our GraphQL schema explorer. You can check out our GraphQL schema explorer here if you want to play around and test your own queries.
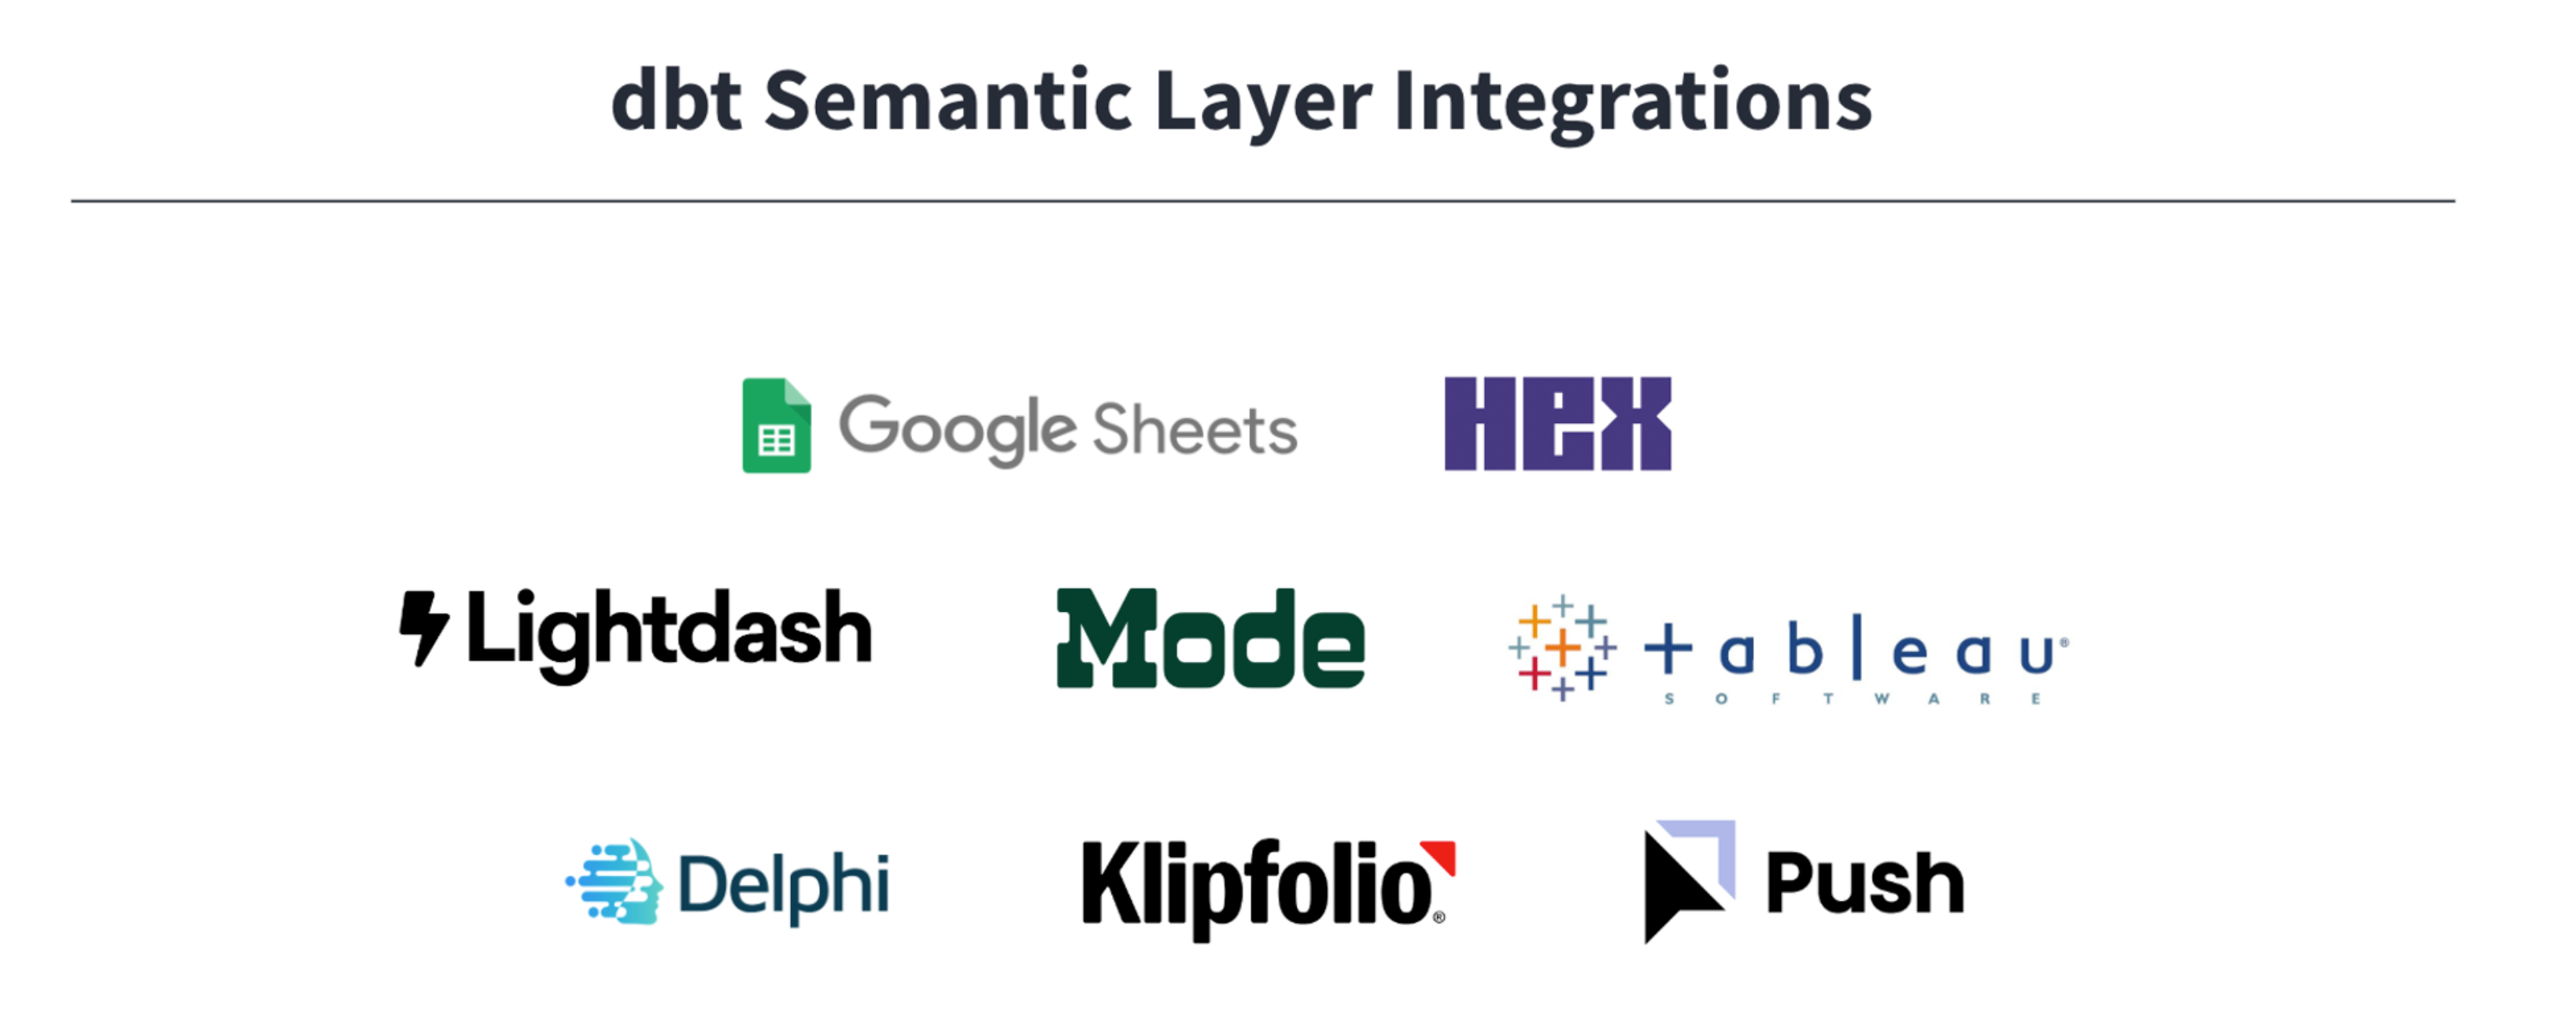
Our APIs power a number of integrations with analytics tools, and we’re investing to continually grow our ecosystem.
MetricFlow Query Generation
Once you’ve completed your dbt Semantic Layer configuration, it’s time to jump into a downstream analytics tool and start requesting some metrics. But how does MetricFlow retrieve the answer when a user queries a metric from their application? The diagram below shows how a user request for “revenue by customer” in their analytics tool flows through the dbt Semantic Layer to deliver that data to the user.
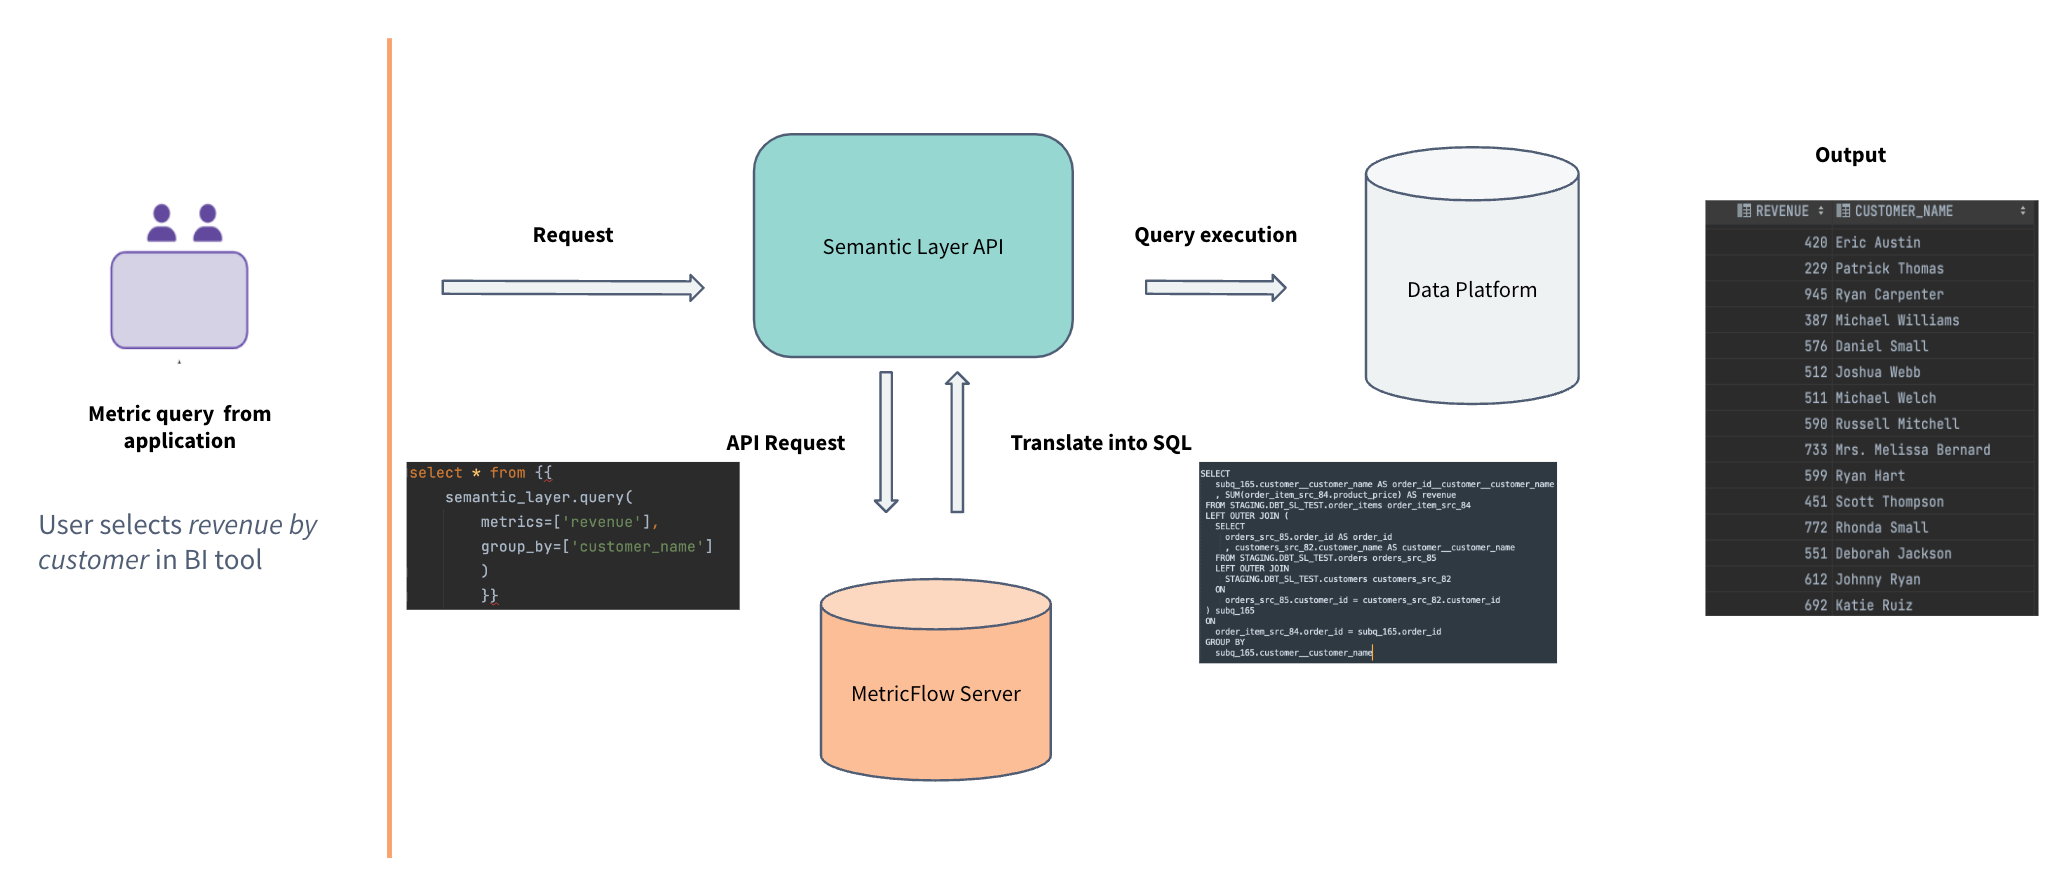
Once a user makes a request in an analytics tool to drag and drop the metric revenue by the dimension customer_name, the dbt Semantic Layer takes the following steps:
- The analytics tool turn this selection into an API request (in this example, we’re using the JDBC API).
- Our API passes the request to the MetricFlow Server, which will use the semantic manifest to generate the full semantic graph of what can be queried. In this case, it will find that
customer_namelives in a different semantic model than whererevenuewas defined, so it knows the SQL generated will have to include a join. - MetricFlow will generate the optimized SQL on the fly, which includes the join.
- Our API gateway will execute it against the data platform and return the rows to the user in their analytics tool. Our underlying data platform support includes Snowflake, BigQuery, Redshift, and Databricks.
The end user doesn’t see any of those steps. They simply initiate a request for data by selecting their metrics and dimensions, and the data is automatically populated in their analytics tool. However, if the user did want to dig in further, our APIs have a compile parameter, which allows you to see exactly what SQL is being generated from the API request.
Bringing it all together
The dbt Semantic Layer is made up of components that are designed to seamlessly deliver consistent metrics to your organization:
- A scalable and streamlined way for data teams to define semantic models and metrics (that live alongside your dbt models!),
- A robust ecosystem of integrations (built from our powerful GraphQL and JDBC APIs) that enable data consumers to ask their questions from a number of analytics tools, and
- The magic of MetricFlow to automate SQL generation
This blog post provides an in-depth look at what’s happening under the hood, but your end users don't need to bother themselves with these details: they simply need to jump into their preferred analytics tool, decide what metrics and dimensions they want to analyze, and then have the peace of mind to make decisions confidently because they know the data they receive is accurate and consistent. By the same token, data teams have a flexible, scalable, and governed way to build and centralize metrics definitions while empowering downstream data consumers to tap into that data themselves.
To get started building out your dbt Semantic Layer configurations, check out our documentation, and reach out in the dbt Community Slack (#dbt-cloud-semantic-layer) if you have any questions.
You can catch our webinar where we walk through a live demo here.
Get started in dbt
Join the analytics engineers building data infrastructure that actually scales.
Install dbt Wizard CLI
Get started with an agent purpose-built for analytics engineering. It knows which tool to call, which context to pull, and checks its own work before surfacing anything to you.