Build, centralize, and deliver consistent metrics with the dbt Semantic Layer

Jan 09, 2024
Product News
At Coalesce 2023, we announced the general availability of the revamped dbt Semantic Layer. The dbt Semantic Layer is now powered by MetricFlow, following our acquisition of Transform in 2023. We’re excited to share more details about the product and how data teams and the business stakeholders they serve are using the dbt Semantic Layer to get consistent metrics wherever they work.
Check out this quick video and keep reading on to learn more.
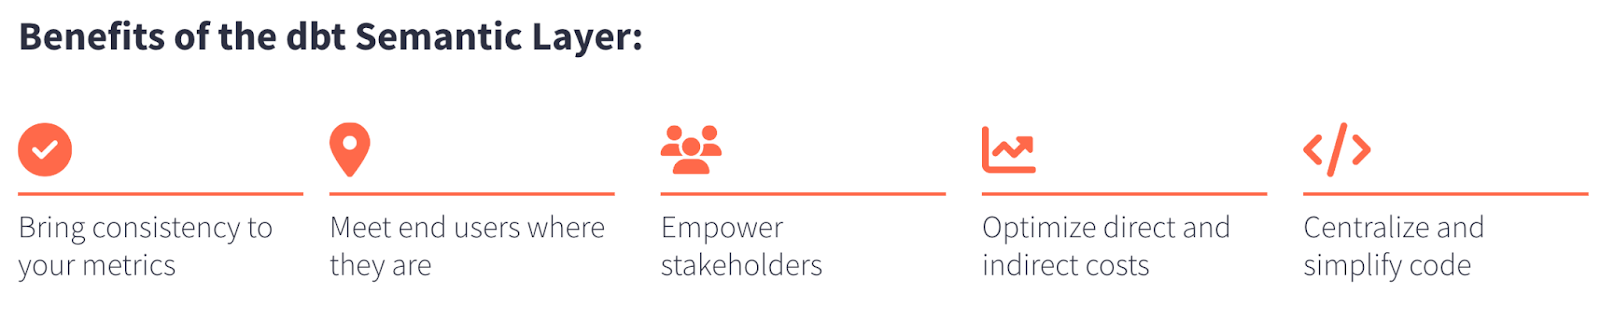
This post dives into the top five customer benefits of the dbt Semantic Layer, with pointed examples and technical details to help you get started.
Don’t miss our upcoming webinar on January 17, 2024 all about how to get value from the dbt Semantic Layer!
Bring consistency to your metrics
The ability to make effective data-driven decisions is a key driver of competitive advantage. Full stop. To really make the most out of data, organizations need to have a consistent, unified, and understandable view of it. And importantly, that view needs to be easily accessible to both technical and non-technical stakeholders.
Teams across a company often use different analytics tools, and when critical metric calculations vary across tools, it’s easy to get caught up debating whose version of reality is right. These inconsistencies ultimately fuel distrust in data and data teams, and lead to inefficient decision making due to technical teams needing to be involved in every data question, which further stunts strategic initiatives to be more “data-driven.”
dbt Labs was founded to abstract away the complexity of modern data systems so organizations could make trusted decisions, faster. The dbt Semantic Layer serves as the translation layer between your business and data teams and optimizes governance and productivity for both teams. Using the dbt Semantic Layer, organizations can codify their metrics in a centralized place and have confidence that they’re getting the same number and context around that number wherever they consume data.
Meet users where they are
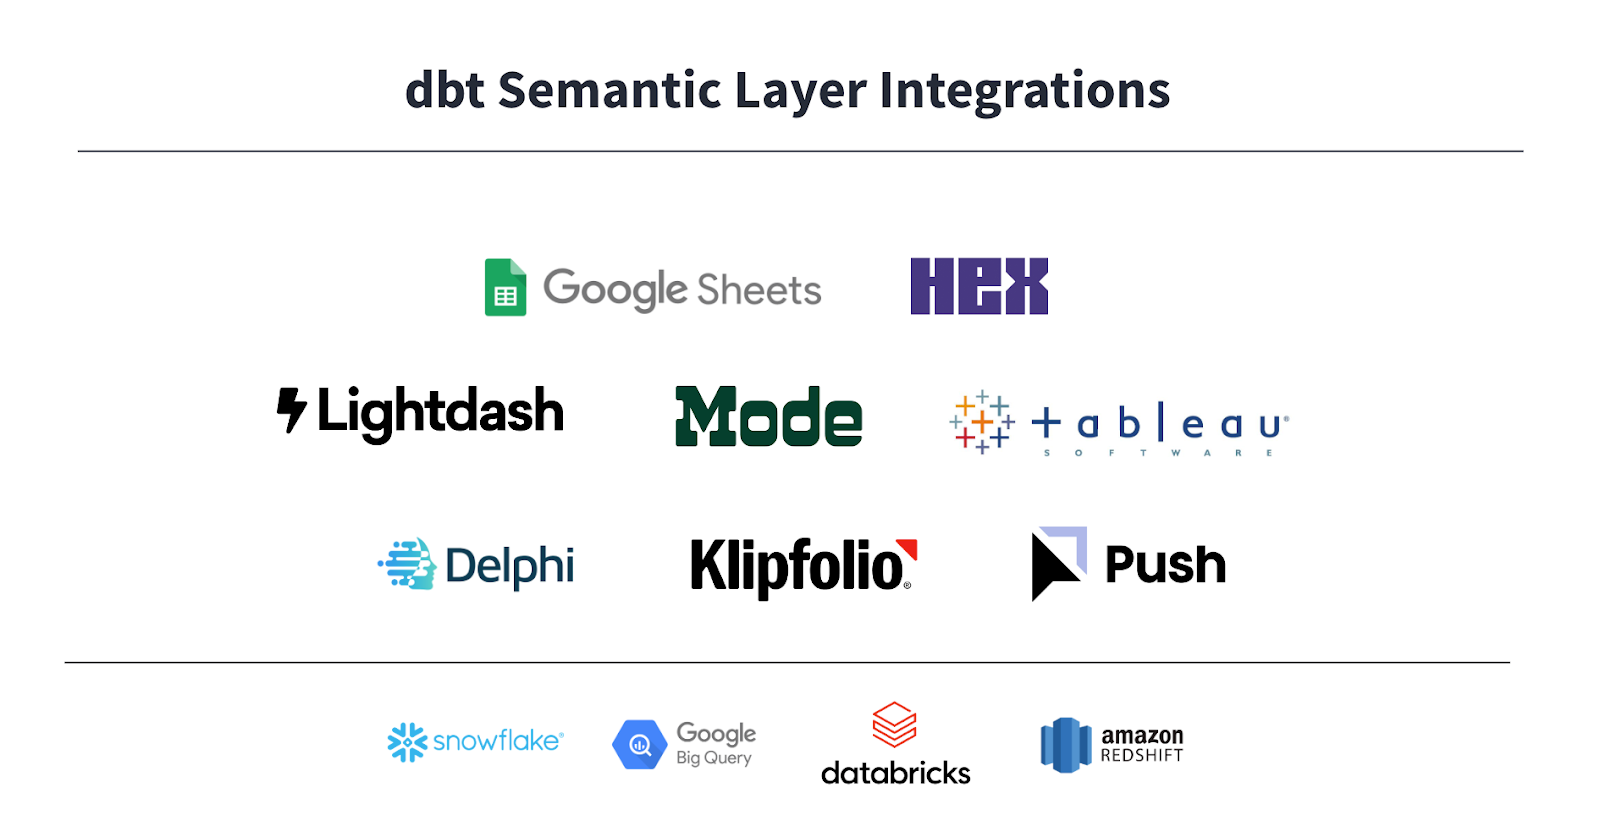
The dbt Semantic Layer is deliberately agnostic to where end data consumers get their information, because in practice, organizations consume analytics data from a multitude of tools, and those tools are always changing. In a world where the cloud data platform is the center of gravity, it’s backwards and inadvisable to build and maintain multiple sources of truth. Your data platform can and should do the heavy lifting: define metrics centrally and then query and access them in whatever tool suits a particular team.
The dbt Semantic Layer offers integrations with a number of data platforms and analytics tools, and we’re investing to continually grow our ecosystem.
The dbt Semantic Layer meets developers where they are, as well. We support generic interfaces like JDBC and GraphQL so developers can build first-class integrations into existing tools, or develop their own homegrown tool.
JDBC is a standard connection for databases, and our API is built upon a protocol called Apache ArrowFlight SQL. ArrowFlight SQL is a new protocol that is known for its scalability; the design offers lower latency and reduces processing requirements, even as the amount of data being transferred gets larger.
Our JDBC interface for the dbt Semantic Layer provides a mechanism to query metrics and dimensions in a SQL-like manner. This is not only used by our downstream analytics partners to build dbt Semantic Layer integrations, but can also be used in tools that support our driver and allow writing custom SQL (e.g., Hex, Mode, and common IDE tools like DataGrip and DBeaver). Below is an example of using our JDBC interface from our Hex integration.
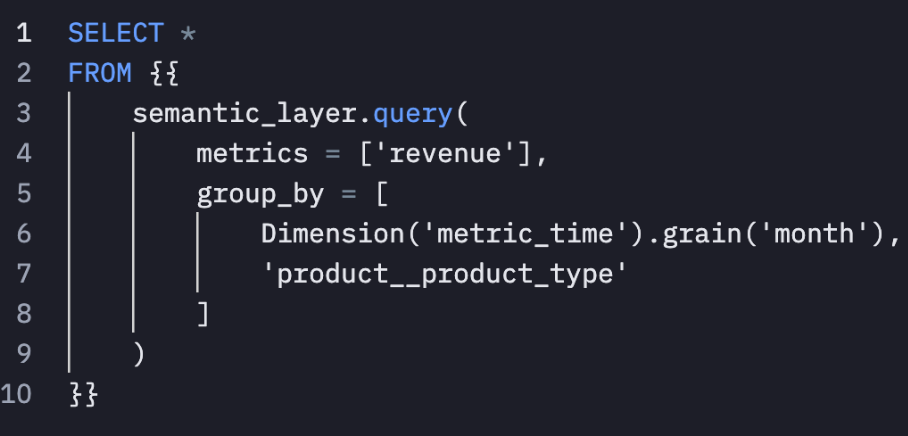
This interface can be used to talk directly to your data platform, too. If you are doing exploratory analysis, you can also join to data that isn’t defined in the dbt Semantic Layer in the same request.
Our GraphQL interface offers similar functionality as far as querying metrics and dimensions, but is a powerful choice for developers who prefer a more structured language and the flexibility of a strongly-typed interface. Below is an example of querying the same metrics and dimensions from our GraphQL schema explorer.
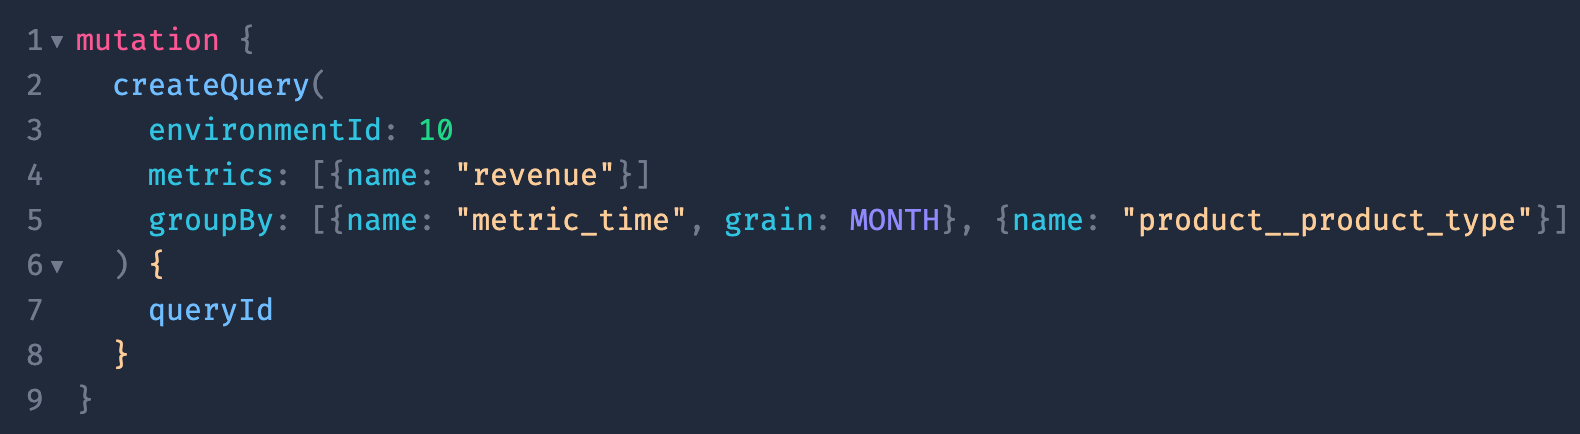
You can check out our GraphQL schema explorer here if you want to play around and test your own queries!
All in all, our philosophy is that everyone should use the tool they’re most comfortable in to get the answers they need, so our approach is to support a broad scope of interfaces and integrations.
Empower downstream stakeholders to get their own answers
Your stakeholders—whether a data analyst, product manager, or RevOps leader—want to be able to answer their own questions and investigate datasets from a variety of angles. Without a universal semantic layer, this data lives across a lot of disparate tables and your stakeholders might struggle to turn that data into actionable insights. A few common roadblocks that emerge:
- They don’t know where to find the data they need
- They aren’t comfortable writing SQL or aren’t empowered to shape or analyze data
- They unknowingly aggregate fields incorrectly
- They unknowingly use the wrong tables or fields to calculate a metric
The dbt Semantic Layer mitigates these concerns by:
1. Providing definitions and other context about a metric as a key part of the development process.
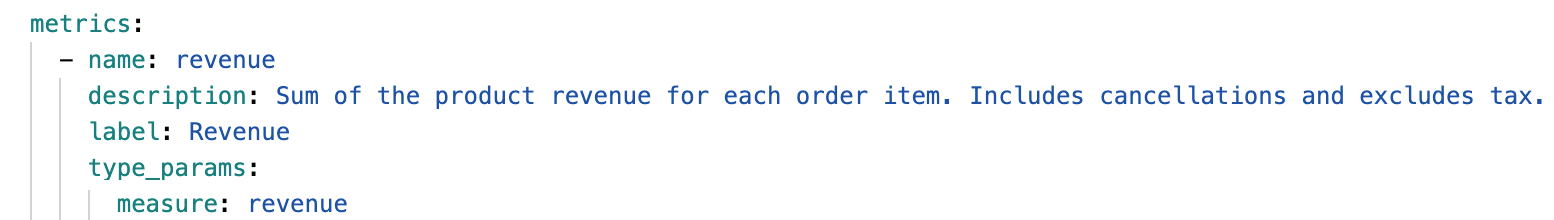
We strongly believe that metrics are more than just the number delivered, and that providing metadata around the metrics in code is key to building confidence for end users who are analyzing those numbers. Here’s an example definition of a revenue metric, which includes a useful description that would preempt any debates that might emerge about “What do we mean by ‘revenue’?”:
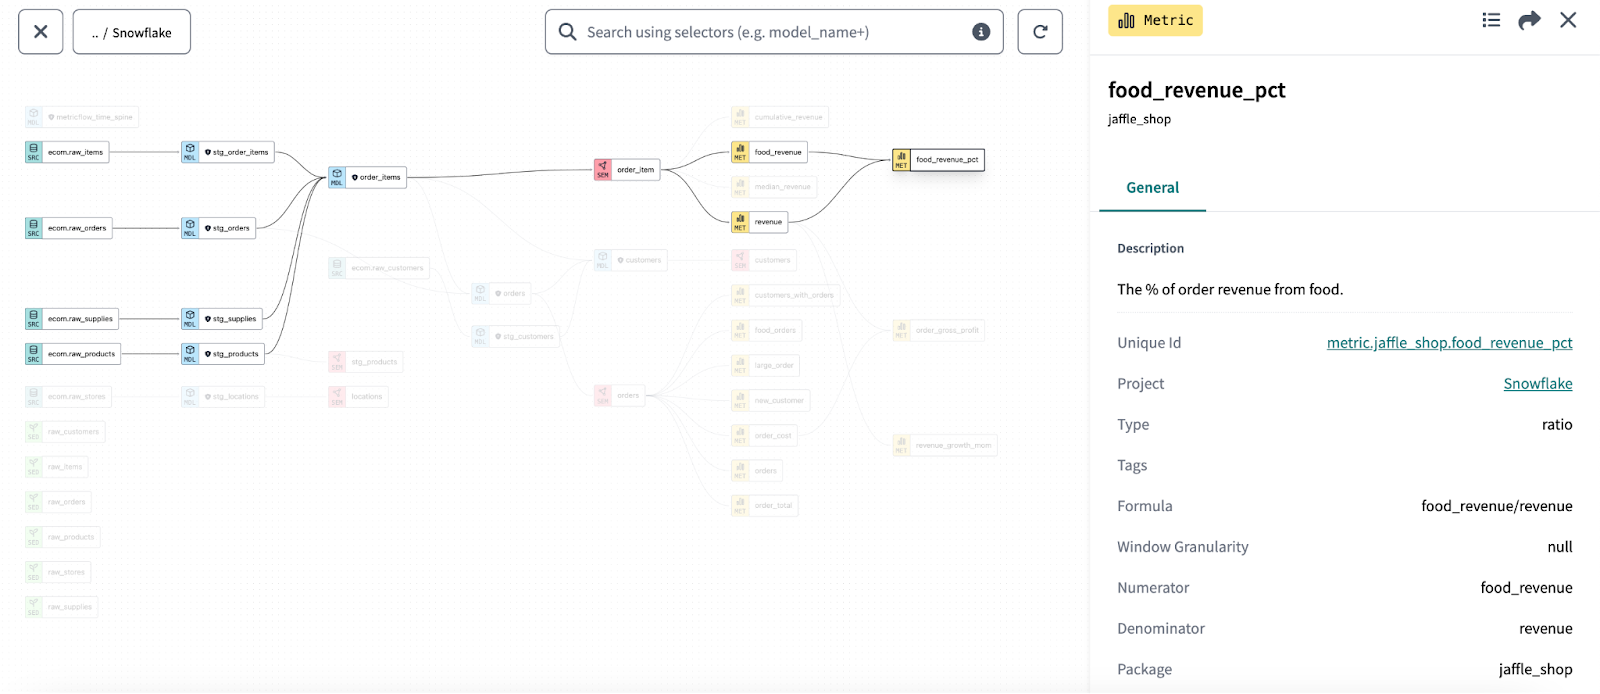
Another added benefit to defining metrics centrally in dbt Cloud is that you can layer on additional context via the information that comes from the full dbt ecosystem. dbt Explorer shows details about your metrics that you’ve defined in the dbt Semantic Layer, but also upstream models and sources, providing you rich context to improve your understanding of the data that went into creating downstream metrics. The dbt Explorer image below shows metrics defined in the dbt Semantic Layer as yellow nodes in the lineage graph.
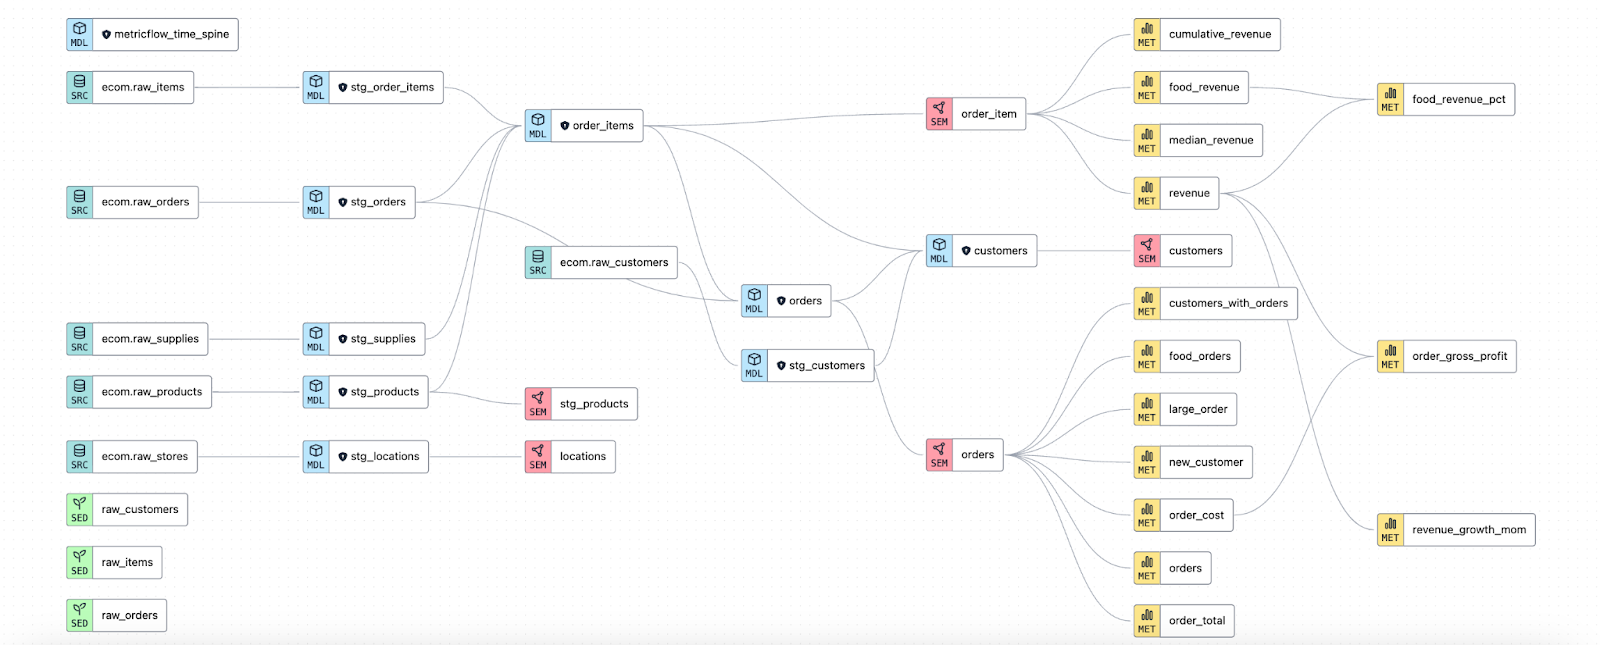
You can click each node to drill further into contextual details and also zoom out to see lineage and dependencies from the entire DAG.
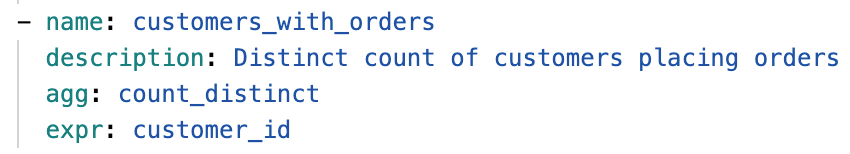
2. Codifying the aggregation type and underlying calculation.
Connecting an analytics tool to tables in the data platform offers users the flexibility to aggregate data as they choose (e.g., via SUM, MIN, MAX, etc.). However, without proper governance, this "self-service" approach may lead to errors in someone’s work. This is especially true when dealing with non-additive measures, like those calculated using count distinct or average . The solution to this issue is to define aggregations in code—as done by the dbt Semantic Layer— which allows users to explore freely without compromising data integrity. This ensures that the context of aggregations is sacred when using downstream tools like Tableau, preventing any incorrect analysis. Here is an example of a measure definition that can be used to build your metrics:
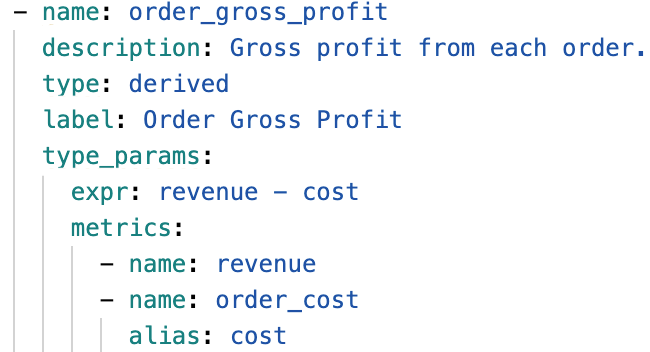
The dbt Semantic Layer not only captures the underlying measure aggregation but also stores the metric calculation in code, and this is at the heart of how we achieve consistency. For instance, a critical revenue metric derived from the expression revenue - cost is defined explicitly. This prevents users from creating calculations that deviate from the organization's canonical definition of "revenue."
3. Dynamically rendering relevant dimensions and metrics.
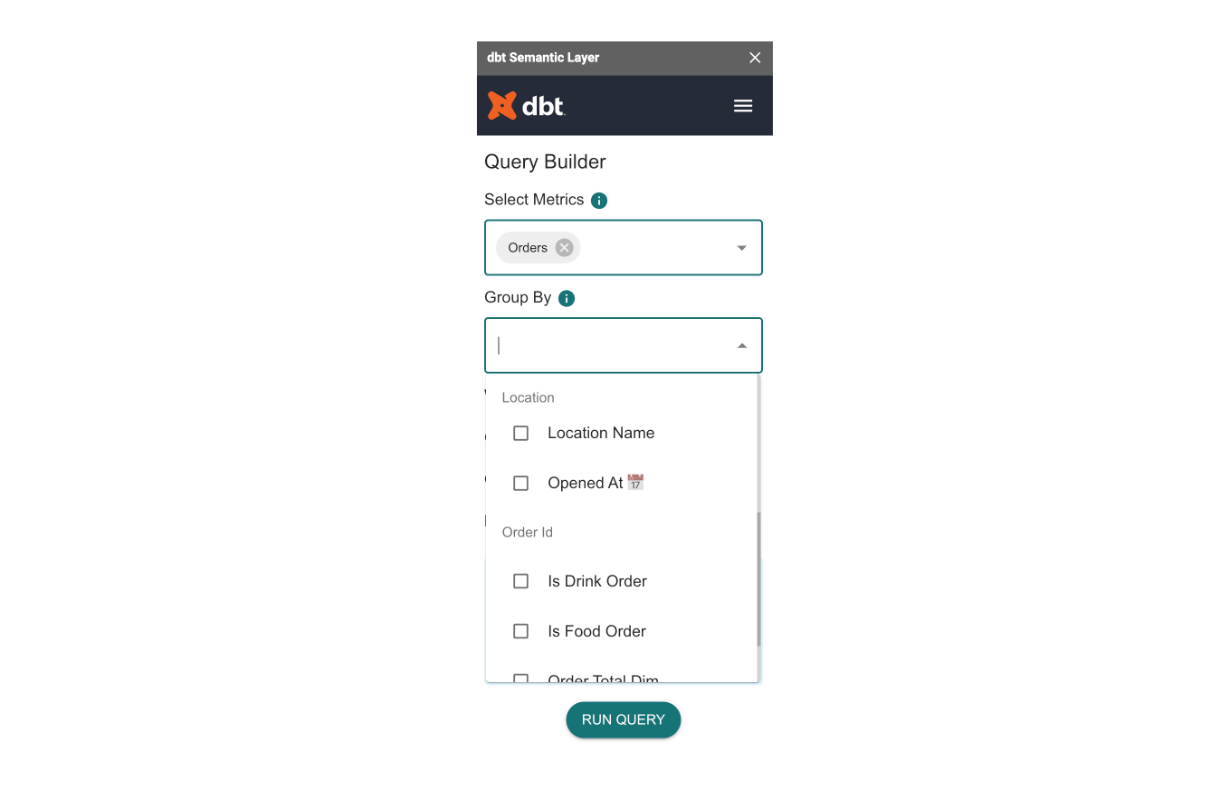
Using MetricFlow’s join navigation, we can expose not only all of the metrics and dimensions available to query in the scope of an organization’s data, but we can also ensure that users are only seeing relevant dimensions when they make a metric selection (and similarly, only see relevant metrics when they make a dimension selection). For example, in our Google Sheets integration, let’s say you select a metric called Orders. When you open the list of dimensions available, you’ll see a few dimensions related to customer location and order type. You can be confident that these are the dimensions that are applicable to the metric that you selected.
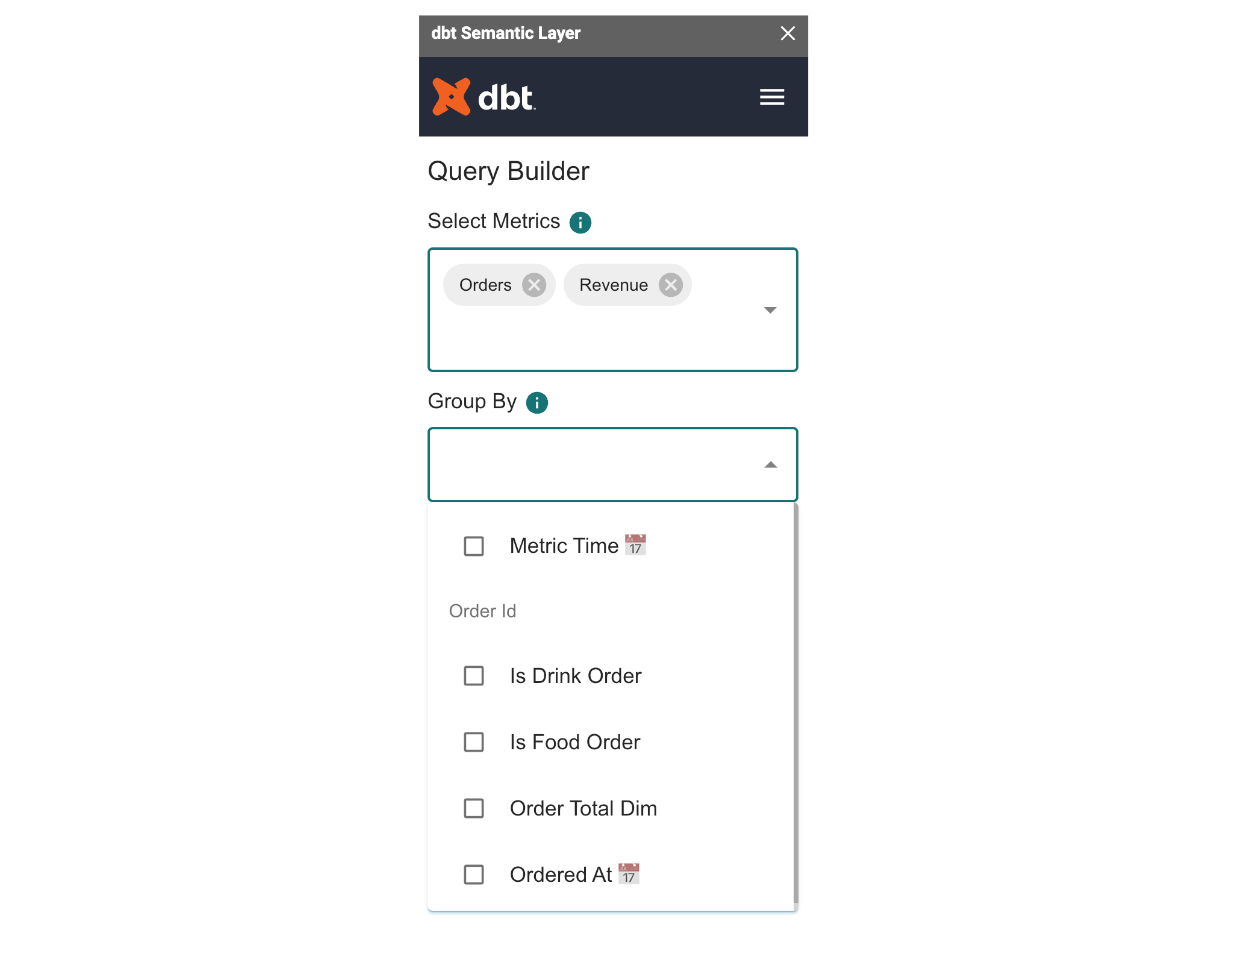
If you add a new metric, let’s say Revenue, the list of dimensions you can join onto dynamically changes and narrows down to only those applicable for the selected metrics, as you can see in the next image, and we will not show the dimensions that aren’t relevant (in this case, the Location dimensions no longer apply once we added Revenue ). These dynamic interactions give the end user confidence that all the dimensions that they see are applicable to their selected metrics, while still providing flexibility to traverse the semantic graph.
Optimize direct and indirect costs
In the absence of a universal semantic layer, data teams will often build multiple massive cubes of data. These cubes include different time granularities and include many dimensions across a wide dataset. This is both time consuming (rebuilding cubes if changes are required is cumbersome) and expensive (continually building and rebuilding massive cubes with data that may or may not be used drives up consumption).
The dbt Semantic Layer solves this problem: with powerful join navigation across data stored in the data platform, you don’t have to worry about everything being on one massive table or view as you make metric requests.
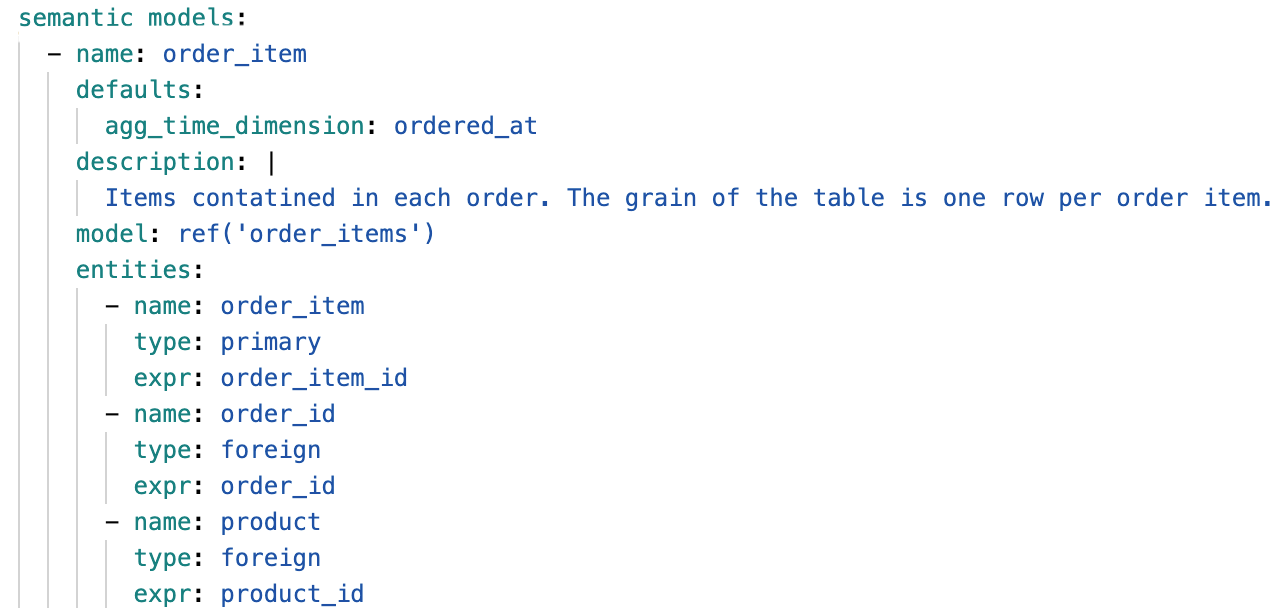
Consider two semantic models which contain product data and order data, respectively.
We can use entities in these models to define how these tables should be joined. As you can see, this order_item semantic model has a couple of foreign key references, and notably we see product is one of them. In this case, we’re showing just the entities in the semantic model.
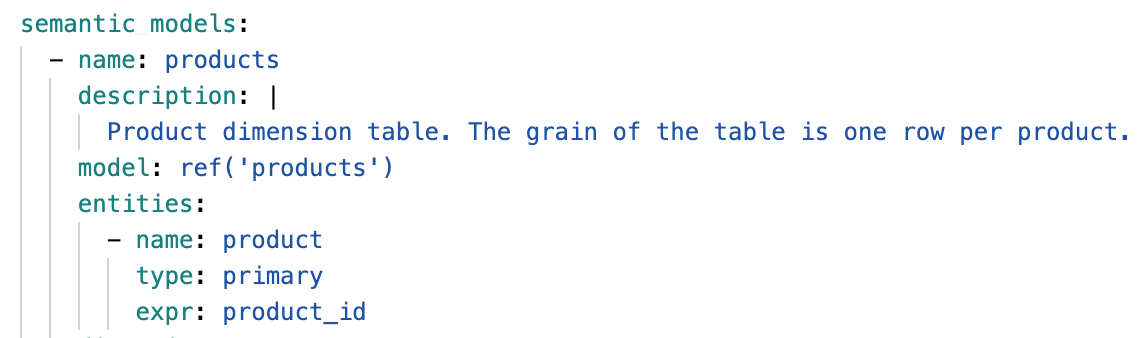
Below, we have the products semantic model with a product primary key. With this configuration alone, if a user wants to query any metric, say order_cost (which is built off the order item semantic model) and join it into a dimension from the product semantic model shown below (say product_type ), MetricFlow generates SQL to compute that data dynamically, so you don’t need to predict every possible metric and dimension combination that end users might query.
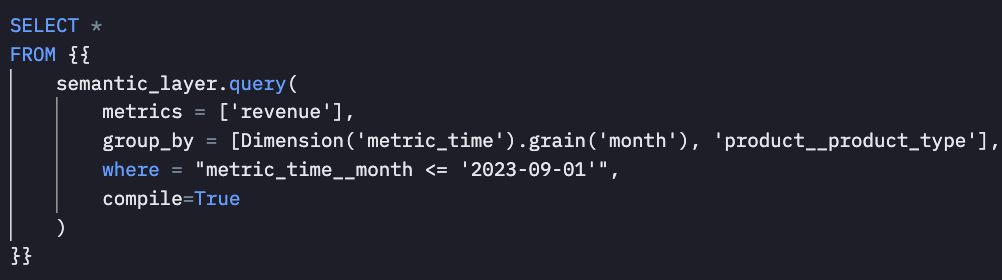
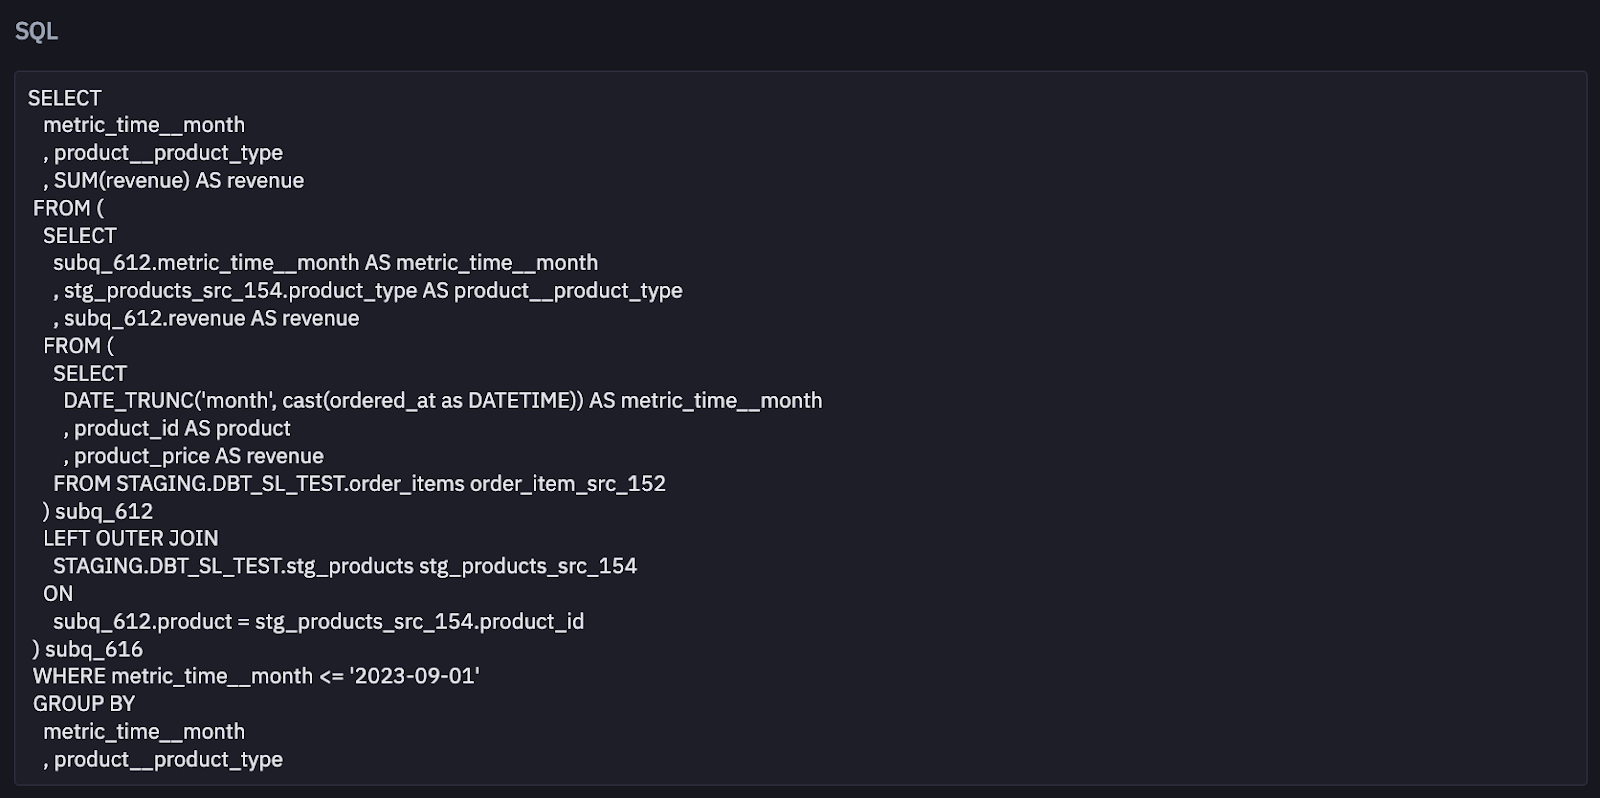
An added benefit is that the SQL that MetricFlow generates is optimized for your data platform. It’s also legible and we can return it to you if requested. All of our APIs have a compile parameter, which returns the raw SQL MetricFlow generated so you can version control, investigate, and ultimately build trust in the data we return.
This is the compile parameter running in Hex, and the output of the full SQL (which includes a join)!
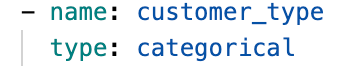
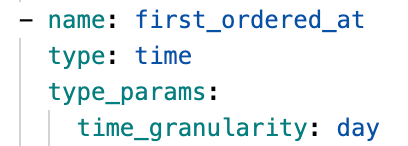
Finally, let’s say an end user wants to add a dimension into an existing cube that’s used in a downstream tool. The standard workflow requires you to drop the table, create the query to join the data, rebuild the table, and either rename the table or create a new table to hook into downstream tools. With the dbt Semantic Layer, all you have to do is add the dimension into the MetricFlow spec, and it’s available to your users. Here’s an example of both a categorical ( customer_type ) and time dimension ( first_ordered_at ) definition in the MetricFlow spec. As you can see in both cases, it’s only a few lines of code.
We’re excited about the potential to optimize spend, and also expect that further cost savings will be realized once we introduce caching in the dbt Semantic Layer (an exciting feature on our roadmap for this year!).
Centralize and simplify your code
The dbt Semantic Layer improves the “DRY”-ness of your code as well as the manageability of it. Rather than maintaining metric logic in multiple places, you can put it in one place and it is a consistent interface to your data since it’s colocated with your dbt models.
This also makes it very easy to future-proof your data access. As you onboard new tools, you don’t need to rewrite any logic—it’s all already in the dbt Semantic Layer.
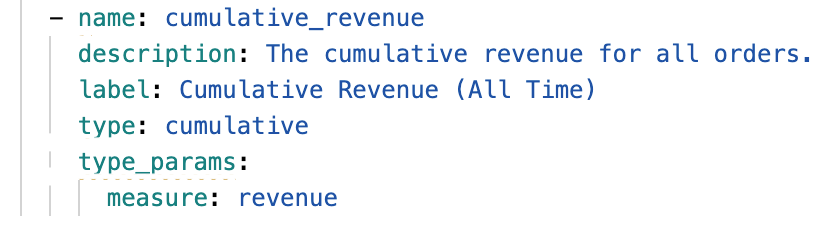
Additionally, our metric definition interfaces can help you simplify your code. We offer simple abstractions to create complex metrics, rather than requiring you to write a bunch of hairy SQL. For example, take a cumulative metric like cumulative revenue . This seems simple, but the SQL to calculate it can be quite messy. Here’s an example of how this can be made simpler—just six lines, including metadata—in MetricFlow:
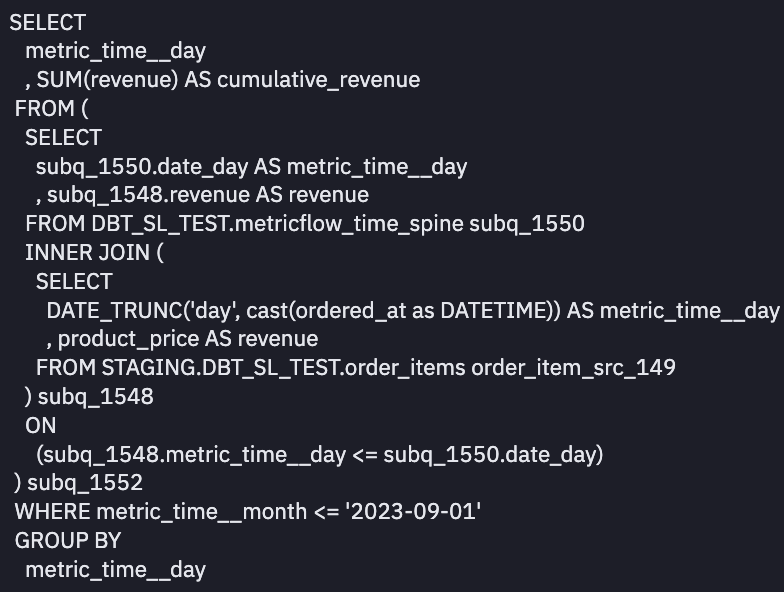
Compare that to the underlying SQL required to actually calculate it, which requires over three times the amount of code, and it still doesn’t include any contextual information.
Let MetricFlow do the heavy-lifting for you with our simple interfaces!
Getting started
The dbt Semantic Layer was built to address real issues—in data trust, data velocity, and data costs—that hold organizations back from embracing a truly data-driven culture. By defining semantic objects on top of dbt models and letting MetricFlow do the heavy lifting of generating the SQL, data teams have a scalable, cost-effective way to ensure metric consistency. And through our simple consumption interfaces, we have a large and growing ecosystem of analytics partners building integrations into the dbt Semantic Layer so that business stakeholders are empowered to get answers in whatever tool they’re most comfortable in.
To get started building out your dbt Semantic Layer configurations, check out our documentation, and reach out in Community Slack (#dbt-cloud-semantic-layer) if you have any questions!
Stay tuned for a Part 2 of this blog post that will provide a deeper technical dive into all things dbt Semantic Layer. In the meantime, be sure to join us January 17 for a webinar where we’ll walk through core concepts and do a live demo of the dbt Semantic Layer!
Last modified on: Mar 05, 2024

Achieve a 194% ROI with dbt Cloud. Access the Total Economic Impact™️ study to learn how. Download now ›